


This article includes an update of the performance of a long-short strategy based on moving averages that adapt to market volatility to identify and follow trends.
Long positions are reversed to short and vice versa so the strategy is always in the market. The strategy is available for sale to professional traders and hedge funds subject to acceptance of a non-disclosure agreement.
Due to the nature of the strategy and the primary objective being identifying and following trends, the backtests sample size for ETFs is small but sufficient in the case of Dow stocks. The strategy uses an adaptation mechanism that adjusts the moving average (called MADAPT) based on daily volatility.
Strategy general description
Buy: SMA > MADAPT
Short: SMA < MADAPT
Backtest details in ETFs for strategy
Time-frame: Daily (adjusted data)
Strategy type: Long-short (reverse)
ETFs: SPY and QQQ
Backtest period: inception to 05/28/2021
Commission per share: $0.01
Position size: Fully invested
Position entry and exit: Open of next bar
Equity and drawdown profile
SPY
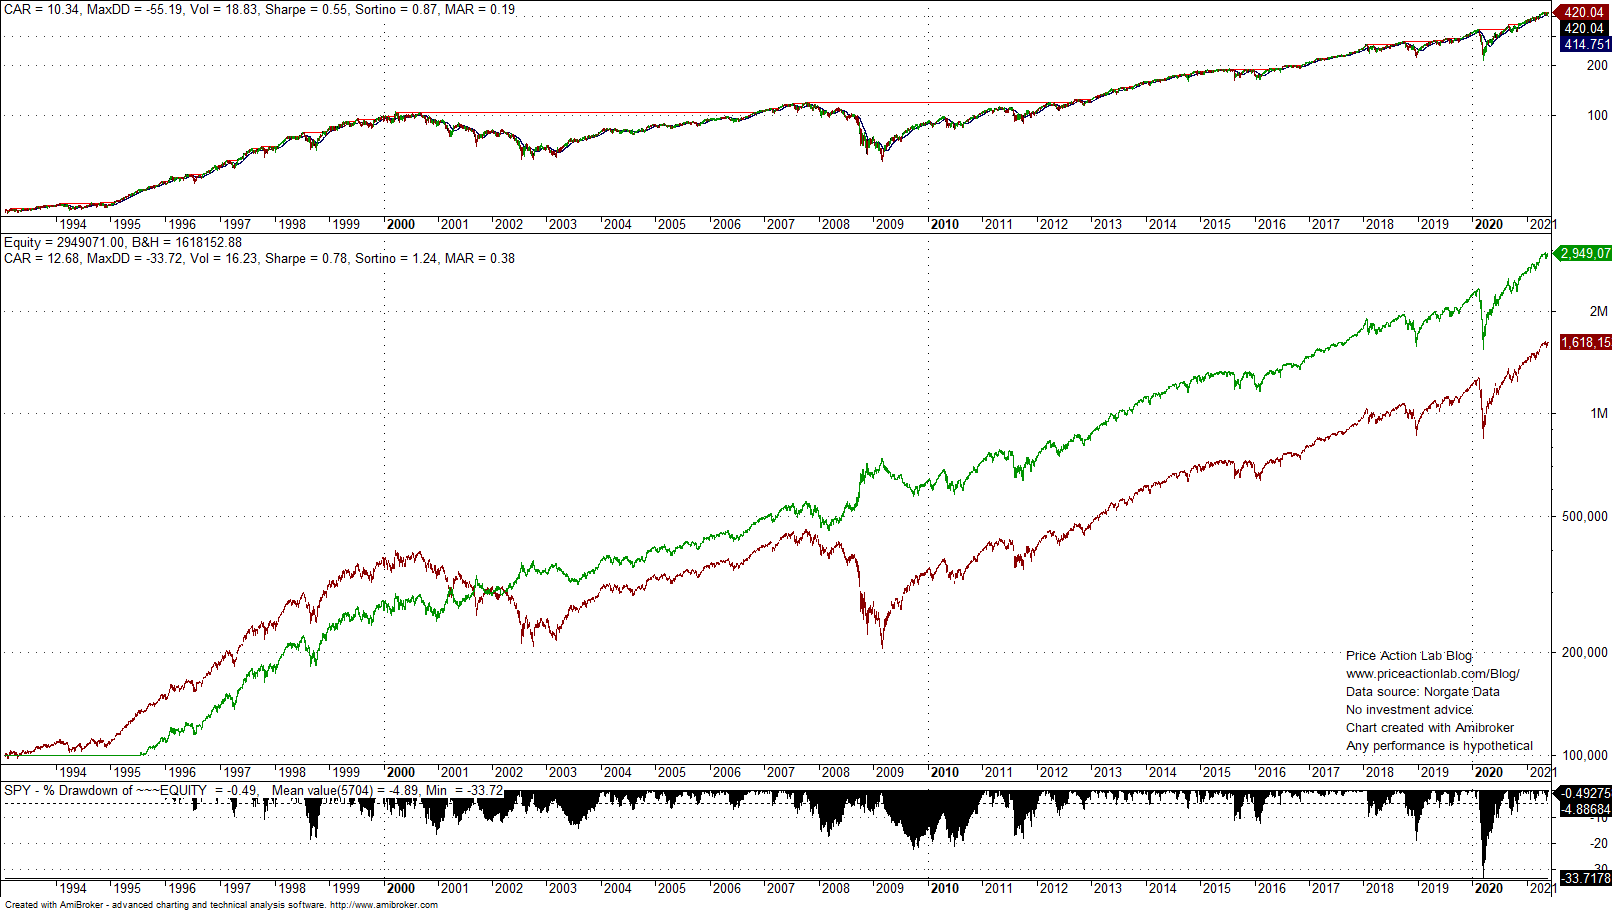
The green line shows the equity growth of the strategy and the red line is the buy and hold. The drawdown profile of the strategy is also shown at the bottom of the chart. After about 2002 the strategy consistently outperforms buy and hold on both absolute and risk-adjusted basis.
QQQ
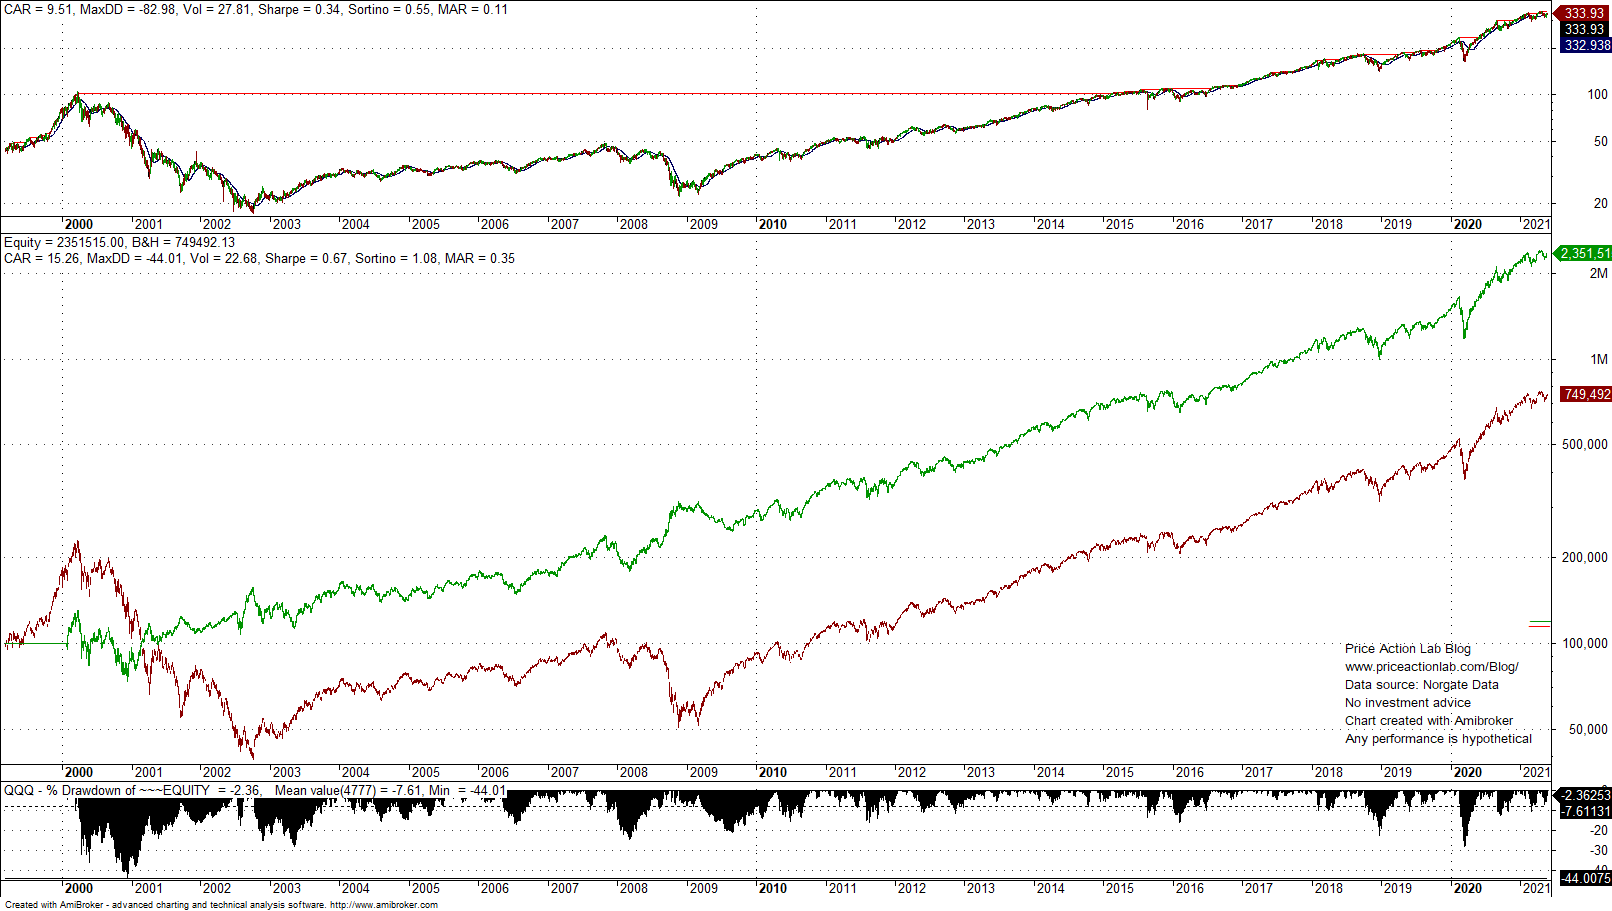
The green line shows the equity growth of the strategy and the red line is the buy and hold. The drawdown profile of the strategy is also shown at the bottom of the chart. After 2001, the strategy consistently outperforms buy and hold on both absolute and risk-adjusted basis.
Note that after 2010 the strategy matches performance of buy and hold in SPY and QQQ and this is actually desirable since a large class of trend-following strategies have underperformed buy and hold in that period and some even significantly. Therefore, the benefit of using this adaptive strategy could be due to performance in bear markets. However, these strategies can be used also in long-only mode and in that case CAGR for SPY is reduced by about 1.5% and for QQQ by about 3%.
Summary of performance
| MADAPT SPY | SPY B&H | MADAPT QQQ | QQQ B&H | |
| CAGR | 12.7% | 10.3% | 15.3% | 9.5% |
| MDD | -33.7% | -55.2% | -44.0% | -83.0% |
| SHARPE | 0.78 | 0.55 | 0.67 | 0.34 |
| TRADES | 5 (3L/2S) | – | 13 (7L/6S) | – |
| WIN RATE | 100% | – | 69.2% | – |
Performance in Dow 30 stocks
For the backtests with Dow 30 stocks we used Norgate data that include current and past constituents to remove survivorship bias. We highly recommend this data service to those who would like to remove survivoship bias from backtests (we do not have a referral arrangement with the company.)

Strategy: MADAPT
Time-frame: Daily (adjusted data)
Strategy type: Adaptive trend-following, long-short (sell and reverse)
Bear market filter: None (all signals taken even during corrections)
Universe: Dow 30 stocks (delistings handled in backtest)
Backtest period: 01/29/1993 – 05/28/2021
Maximum open positions: 10
Commission per share: $0.005
Position size per stock: Available equity/10
Trade entry: Open of next bar
Stop-loss: None
Rank metric: 252-day rate-of-change
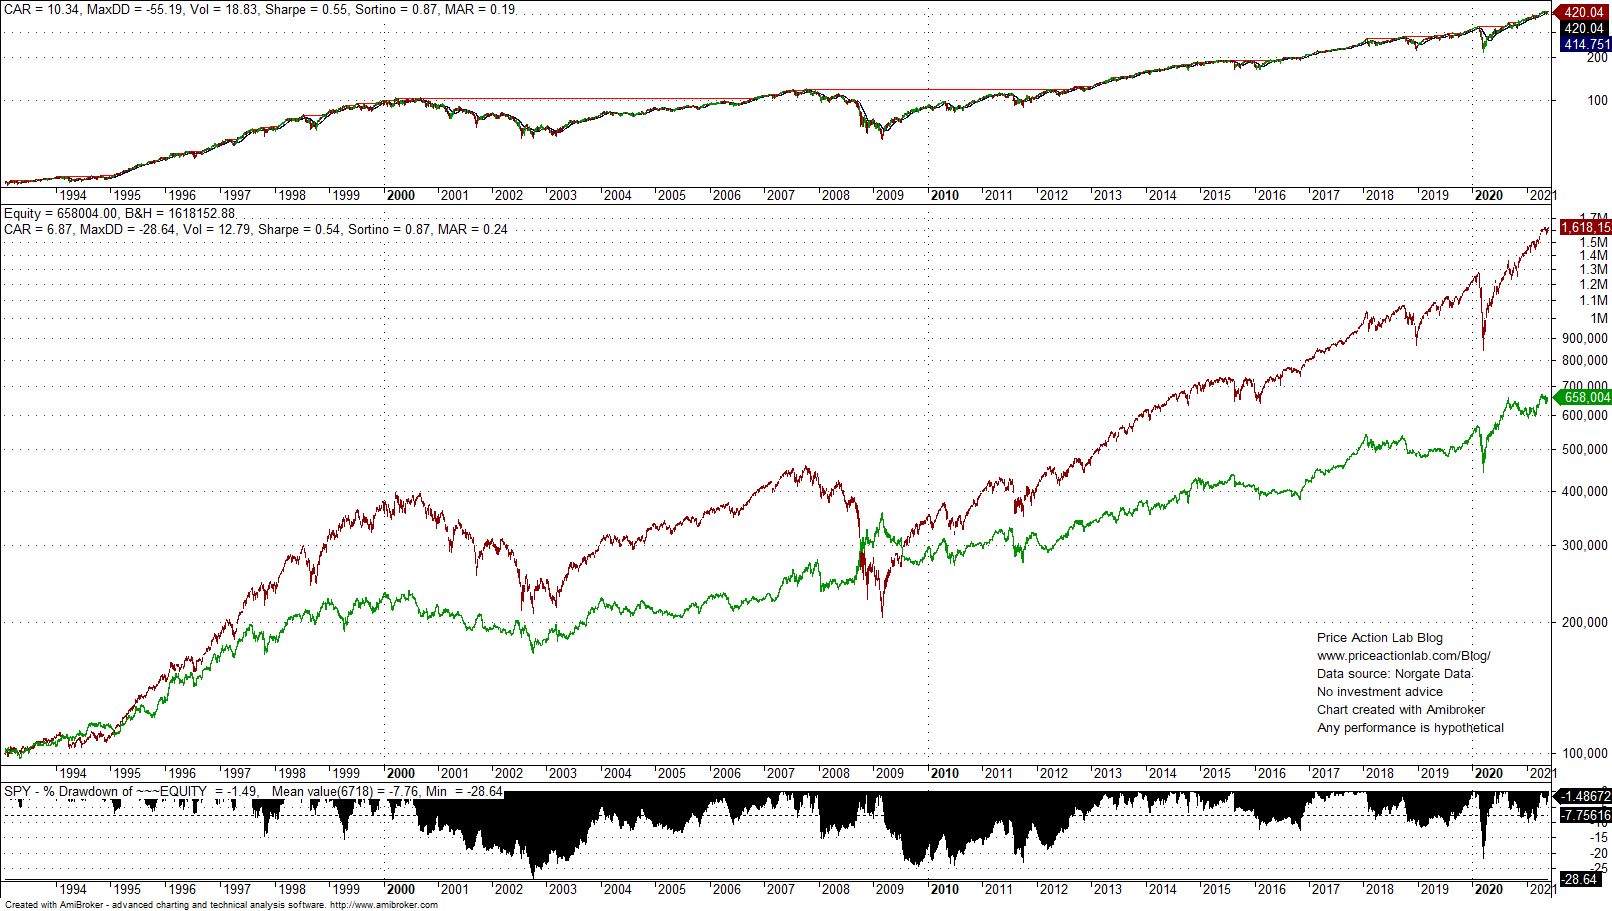
The green line shows the equity growth of the strategy and the red line is SPY buy and hold. The strategy outperforms buy and hold on risk-adjusted basis. CAGR for B&H is 10.3% versus 6.9% for the strategy but MAR (CAGR/MDD) for the strategy is 0.24 versus 0.19 for buy and hold. There are 388 trades in the backtest period with 47% win rate. In 2008 the strategy gained 11%, in 2011 it gained 5.3% and in 2020 it gained 14.7%. Year-to-date the strategy is gaining 6.6%.
As noted before, this strategy works well only in markets that have extended trends because it is fundamentally a longer-term trend-following system.
The strategy is available for sale to professional traders and hedge funds subject to acceptance of a non-disclosure agreement.
Charting and backtesting program: Amibroker
Data provider: Norgate Data
Technical and quantitative analysis of major stock indexes and 34 popular ETFs are included in our Weekly Premium Reports. Market signals for position traders are offered by our premium Market Signals service
If you found this article interesting, you may follow this blog via RSS or Email, or in Twitter


