


Although it’s used frequently by financial mainstream media journalists and even technical traders, the definition of a bear market for a stock that has fallen 20% from all-time highs often does not make any sense.
TSLA fell to a low of 978.6 yesterday and the drop of the stock from the all-time high of 1229.09 on November 4 became -20.4% intraday. It didn’t take a minute and some had already used the “B” word: “TSLA has entered a bear market”.
It doesn’t make any sense to use a 20% drop from all-time highs to declare a bear market in the case of growth stocks. I’m not even sure it makes sense in the case of indexes. Below is the chart of TSLA closing prices with the drawdown profile measured from all-time closing highs and also the compound growth of $1 since IPO.
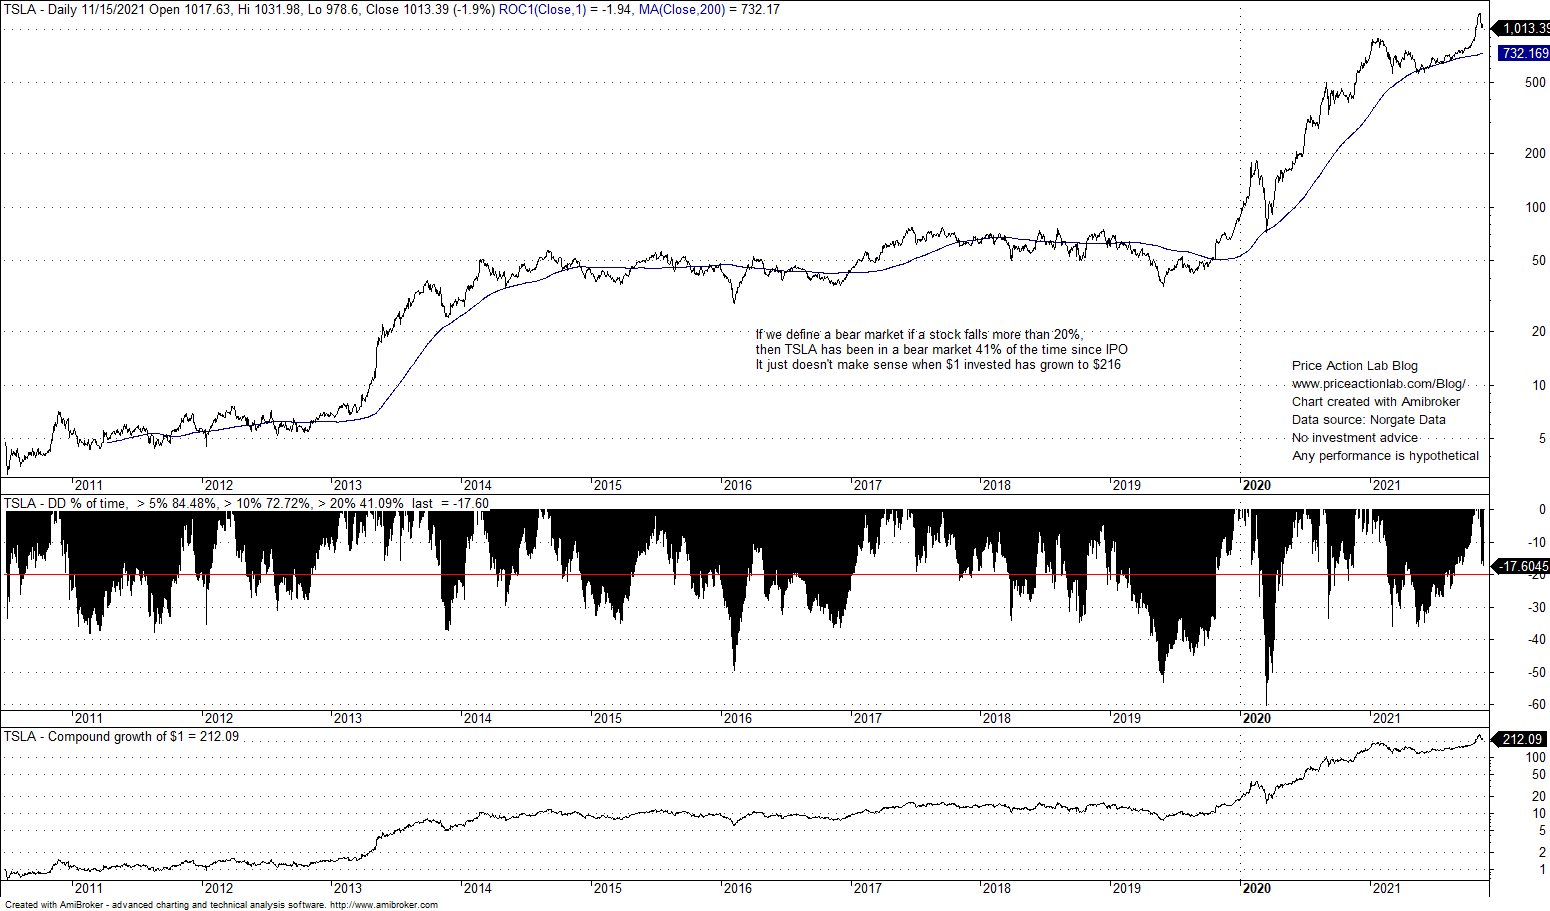
As indicated on the above chart, TSLA has been in a drawdown larger than 20% about 41% of the time!
Then according to the naïve definition of a bear market, TSLA has been in one 41% of the time! Yet, $1 has grown to $212 in the same period!

At least we have to look at charts and perform basic calculations to make sure the definitions we use make sense. A 20% drop for bear market for stocks that can move on parabolic uptrends doesn’t make any sense.
Below is another example: NVDA

According to the naïve definition of a bear market, NVDA has been in one 66% of the time since IPO!
Yet $1 has grown to $800.8, which means the stock has been a cash generating machine especially after 2013.
Does a 20% drop from all-time highs make any sense in the case of indexes? Below is the chart for S%P 500 total return since about 1998.
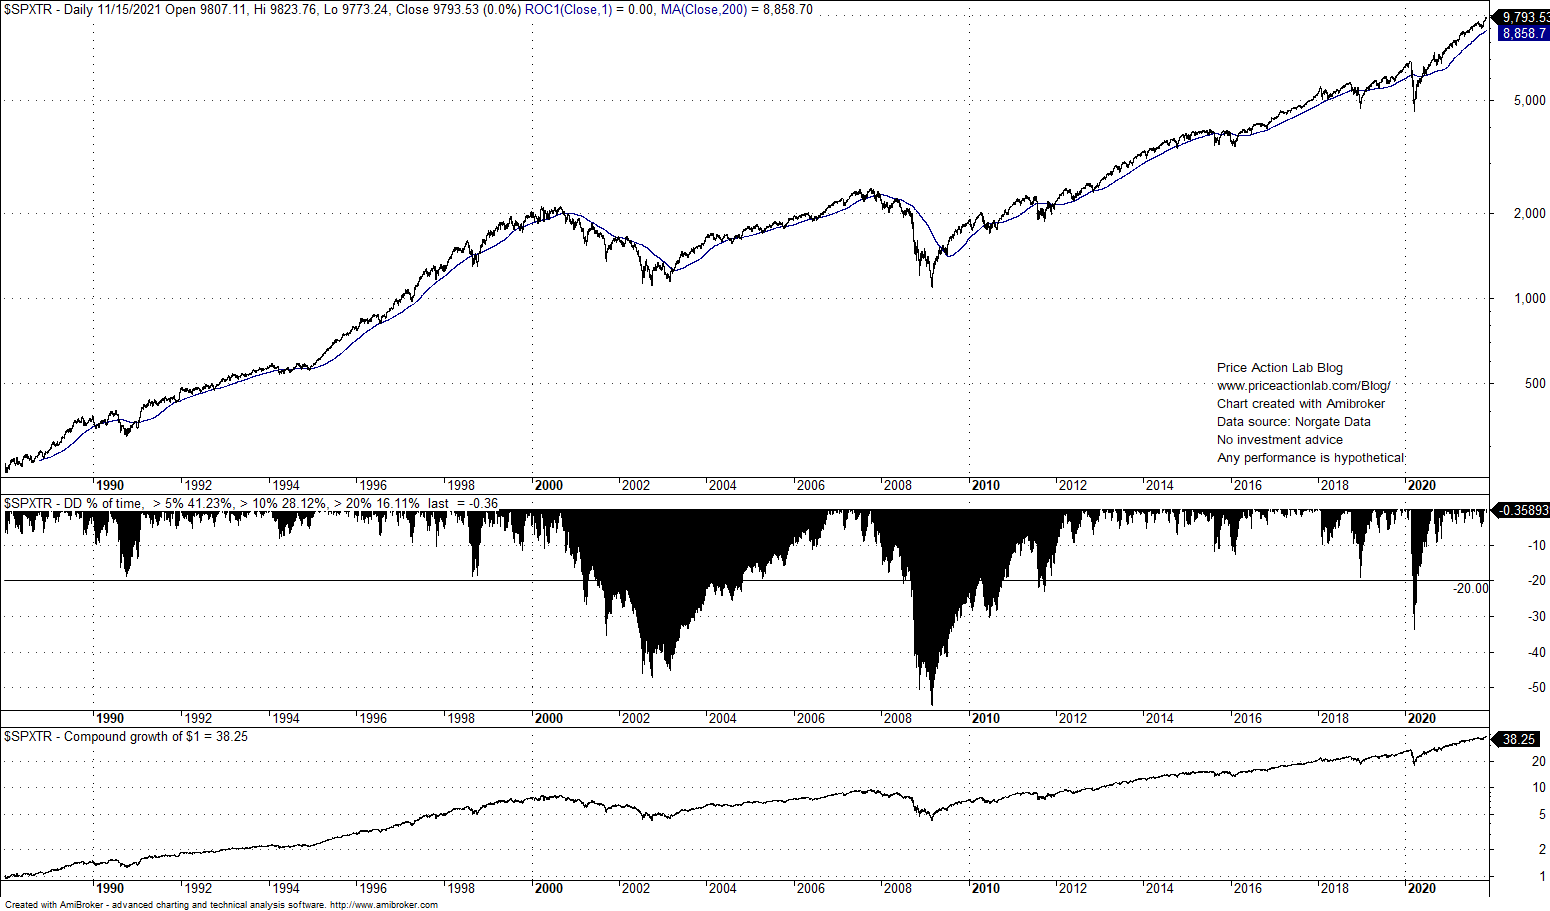
In this case the definition seems to fit the narrative for the dot com and GFC bear markets, as well as, for the 2020 crash.
It appears then that a specific definition that applies in a certain way only to S&P 500 is being used indiscriminately in other markets where it may make no sense.
Charting and backtesting program: Amibroker. Data provider: Norgate Data
If you found this article interesting, you may follow this blog via RSS or Email, or in Twitter
Copyright notice: Any unauthorized copy, reproduction, distribution, publication, display, modification, or transmission of any part of this report is strictly prohibited without prior written permission. Disclaimer

10% off for blog readers and Twitter followers with coupon NOW10. Click here.


