


Crude oil settled down $10.24/bbl on Friday, November 26, 2021, and that is the fourth largest drop since March 1983. How to properly measure extreme crude oil moves.
As shown below, crude oil fell $10.24/bbl on Friday, November 26, 2021. This is the fourth largest drop since March 1983.
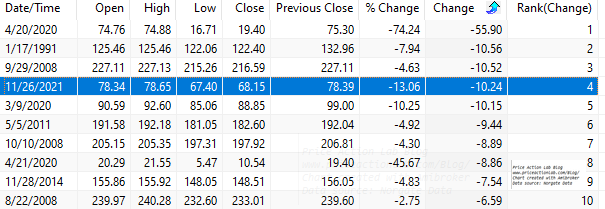
Note that four of the largest ten drops have occurred in the last two years. Three of the largest ten drops occurred in 2008. Below is a chart of daily crude oil changes measured as the difference between two consecutive closing prices.

A few clarifications are required at this point. You may often see percentage changes comparisons in long-term charts. This isn’t the recommended way for commodity futures contracts. Below are some of the reasons:
(1) Most of the charts used are continuous but not back-adjusted. As a result percentage and point changes may be affected by rollovers.
(2) Many equity traders treat commodity futures like stocks (unfortunately also bonds) and report percentage changes. Due to the fixed contract size commodity traders are accustomed to use point changes because those translate directly to dollar values. Each crude oil contract is fixed for 1,000 barrels and minimum tick size is 0.01 per barrel, worth $10 per contract. Therefore, $1/bbl change is $1,000 per contract and $10/bbl change is $10,000 per contract. When changes are reported as points, the conversion to dollar value is straightforward.
(3) If back-adjusted contracts are used, then percentage changes could be problematic because they aren’t invariant under addition/subtraction to back adjust the futures. On the other hand, percentages are invariant in adjusted stock data due to the method used.
(4) The above also impact backtesting as it should be clear but this is beyond the scope of this brief article.
While it is probably fine to report a recent percentage drop, comparisons with past percentage changes may not be accurate. For the tables and charts in this article I’ve used back-adjusted contract and the front one corresponds to the January 2022 contact.

Let us next look at weekly data. Traders care more about daily data because they are marked-to-market daily but producers may be looking at weekly or even monthly.

In the case of weekly data, last week’s drop was ranked number 22. Note that heavy clustering of extreme moves occurred from 2007 to 2012.

Therefore, how extreme moves are, also depends on timeframe. In the monthly timeframe, this was the seventh worst down month since March 1983.
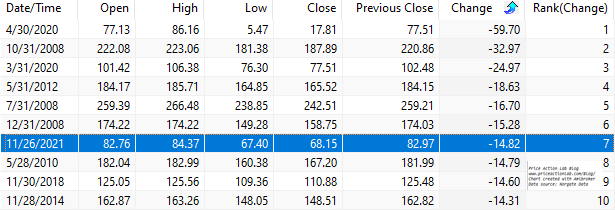
However, notice that 2008 and even 2012 have delivered larger down moves.
Charting and backtesting program: Amibroker. Data provider: Norgate Data
You may follow this blog via RSS or Email, or in Twitter. Disclaimer
10% off for blog readers and Twitter followers with coupon NOW10


