


If there are data available to allow longer backtests but are not used, this could be the result of a dangerous and potentially misleading practice known as “data fishing.” Below is a specific example based on a popular momentum strategy for trading equities.
The strategy trades S&P 500 stocks and was probably discovered and disclosed in the past by someone. It has been used as the foundation for developing many variations of momentum strategies primarily by stock signal providers and others, even possibly by some funds. The strategy holds up to 10 stocks and rebalances the portfolio monthly based on some technical criteria.
I won’t discuss the specifics of the strategy because I believe it’s a dangerous scheme and anyone using it, or its many variations, may face unpleasant surprises in the future no matter what changes or improvements are made to the basic idea.
One particular interesting aspect of the strategy is that it uses a filter to avoid the 2008 bear market. However, as we shall see below, all bear markets don’t have the same dynamics and a filter may work well in one but not during another. Due to failure of the filter to limit losses shortly after dot com top, most backtests I have seen start in January 2007.
There is no reason for backtests to start in 2007 unless there are no available data as it is the case with some ETFs, like GLD or DBA. There are series for S&P 500 constituents going back several decades and thanks to companies line Norgate Data, there are also series that include delistings to remove survivorship bias from backtests.
For all backtests in this article I used Norgate data for S&P 500 index that include current and past constituents. I highly recommend this data service (I don’t have a referral arrangement with the company.)

Below is the equity curve of the strategy (black) and of SPY buy and hold (gold).
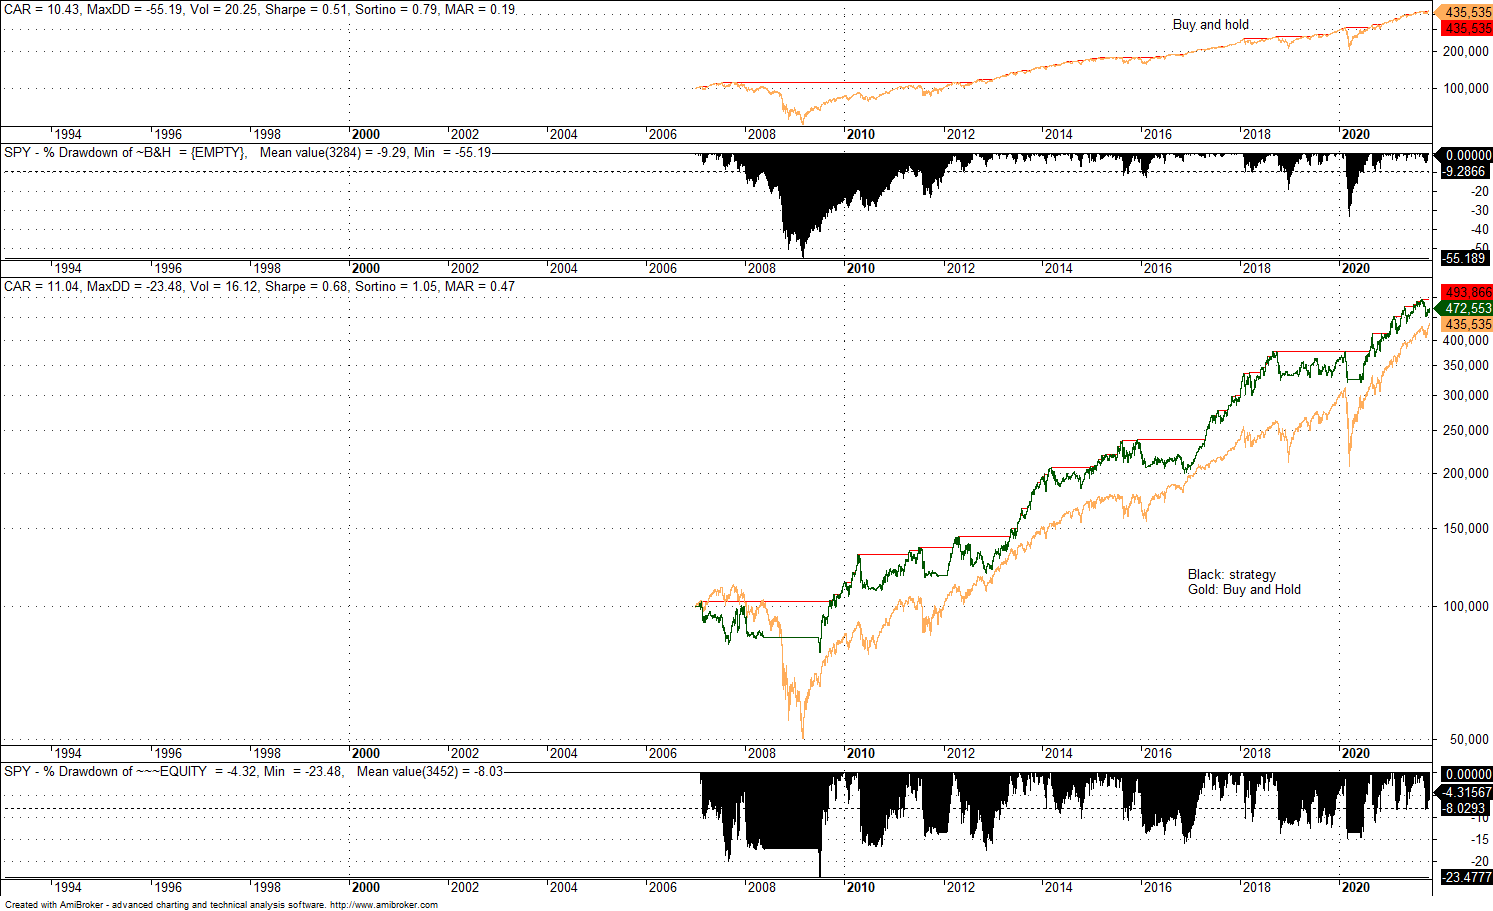
The above backtest offers the impression of a robust strategy with excellent absolute and risk-adjusted performance: annualized return is 11% as compared to 10.4% for buying and holding SPY. Maximum drawdown is less than 23.5% and within the “pain threshold” of most hedge funds and individual investors. But the improved performance is only possible after avoiding the 2008 bear market.
Case 2. Backtesting the strategy starting on 01/29/1993 (SPY ETF inception date)

The main change from Case 1 is a significant increase in maximum drawdown from -23.5% to -36%. Since maximum drawdown above 30% “does not sell well”, many backtests of momentum strategies for equities start in 2007 but claim to be including the dreadful 2008 bear market. Why not including also the 2000-2003 bear market that was also as, or even more, damaging? There is no excuse for not including that period in backtests, except if the performance deteriorates, or there are no data available.
A maximum drawdown of more than 30% may cause panic to most traders/investors and significant redemptions to hedge funds and/or closing down of operations. Some experienced retail traders may know how to deal with large drawdown levels and how to adjust position size but investors usually panic easily and hedge funds are often forced to liquidate after been hit by redemptions. Strategies with high maximum drawdown potential are a source of tail risk, especially those that trade momentum in an environment that has been ruled primarily by mean-reversion since at least 2000.
Conclusion
There is no reason for a backtest to start after 2003 unless there are no available data, or this may be the result of data fishing. When presented with a backtest starting after 2003 for strategies that trade equities, it’s reasonable to demand to see results that at least match SPY ETF inception on January 23, 1993. The larger the sample made available, the lower is the probability of getting fooled by data fishing. Strategies with maximum drawdown larger than 30% reflect high risks and are mostly unsuitable for use by investors and funds.
Disclaimer: No part of the analysis in this blog constitutes a trade recommendation. The past performance of any trading system or methodology is not necessarily indicative of future results. Read the full disclaimer here.
Charting and backtesting program: Amibroker. Data provider: Norgate Data
If you found this article interesting, you may follow this blog via RSS or Email, or in Twitter

Price Action Lab Blog Premium Content


