


When compared to Invesco QQQ Trust Series 1 and even to a simple momentum strategy, ARK Innovation ETF now appears too expensive.
Below we compare the performance of ARK Innovation ETF (ARKK) from inception to December 2, 2021, to the performance of QQQ Trust Series 1 and a simple momentum strategy.
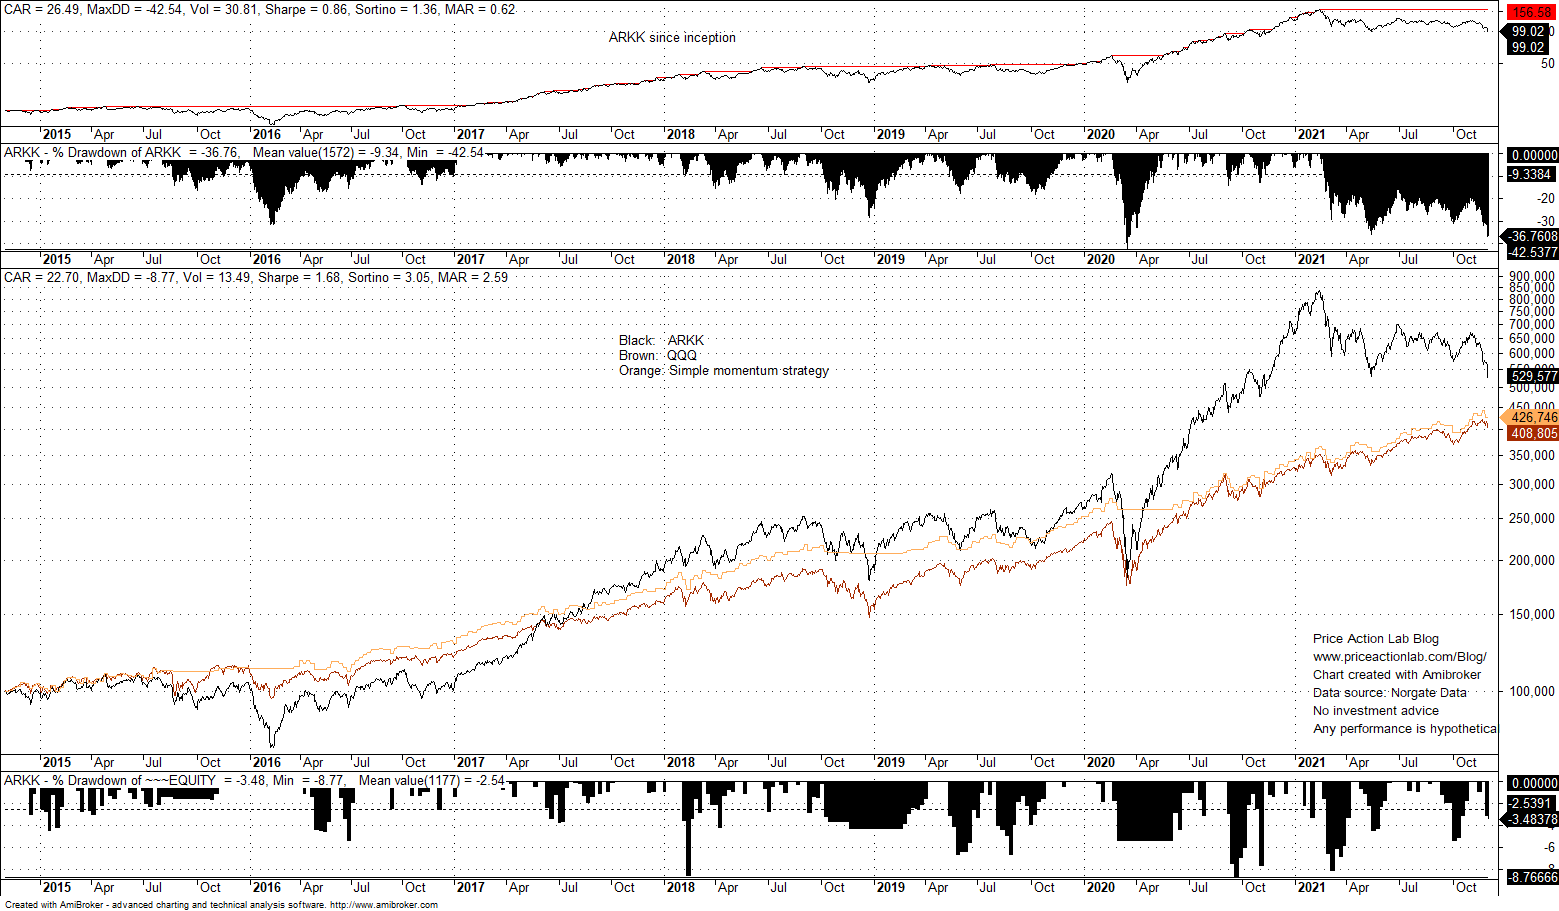
The top chart shows the performance of ARKK ETF and below it is the drawdown profile. The next chart shows three equity curves for a $100K initial investment since the inception of ARKK on October 31, 2014, as follows:
- The black line is the equity of the investment in ARKK
- The brown line is the equity of QQQ buy and hold
- The orange line is the equity of a simple momentum strategy
The table below summarizes the performance of the above three equity lines.
| Metric | ARKK | QQQ B&H | Momentum Strategy |
| Annualized return | 26.5% | 22% | 22.7% |
| Max. Drawdown | -42.5% | -28.6% | -8.8% |
| Volatility | 30.8% | 20.8% | 13.5% |
| Sharpe | 0.86 | 1.06 | 1.68 |
| MAR | 0.62 | 0.77 | 2.52 |
| Sortino | 1.36 | 1.63 | 3.05 |
Summary
- ARKK has the lowest average return per unit of risk (Sharpe, rf=0)
- ARKK has the lowest return per unit of bad risk (Sortino, rf = 0)
- ARKK has the lowest MAR (annualized return/max. Drawdown)
ARKK is down about 37% from February highs in a move that could be described loosely as “reversion to the mean.” At this point and in hindsight only, the ETF appears as an expensive way (0.75% expense ratio versus 0.2% for QQQ) to invest in the tech market. There is possibility of a rebound but a history of “mean-reversion” has been already established.
The momentum model listed in the above table is very simple and does not diverge at its core from known momentum models. It is listed for comparison only and its logic is not disclosed because that is beyond the scope of this article.
Conclusion
Up to February of this year, ARKK showed promise of unique outperformance but the downtrend that followed is reminder that high returns come at possibility of high risks and even uncle point risk. There may be other, even simpler ways, of archiving high returns without risking an uncle point. Although one could still claim the performance of ARKK is high since inception, no one has a time machine to achieve that and we must look forward based on the characteristics of realized performance. My own limited analysis shows that trying to pick tech stocks eventually leads to an absorbing barrier. We know this occurred a few times in the past and particularly during the dot com crash but risks are now even more elevated due to technology facilitating faster corrections and central banks fueling an asset bubble.
Charting and backtesting program: Amibroker. Data provider: Norgate Data
You may follow this blog via RSS or Email, or in Twitter. Disclaimer
10% off for blog readers and Twitter followers with coupon NOW10


