


Historically, large daily gains have occurred along downtrends or at bear market bottoms. Large daily gains are rare during uptrends. This is maybe counter-intuitive but this is how the market has behaved up to this point.
In this article, when the S&P 500 is above the 200-day moving average we define this as an uptrend and when the index is below the average, as a downtrend. This is done for illustrative purpose only.
The chart below shows occurrences of daily returns larger than +7% (top chart) and larger than +3% (bottom chart) during uptrends and downtrends according to above definitions.
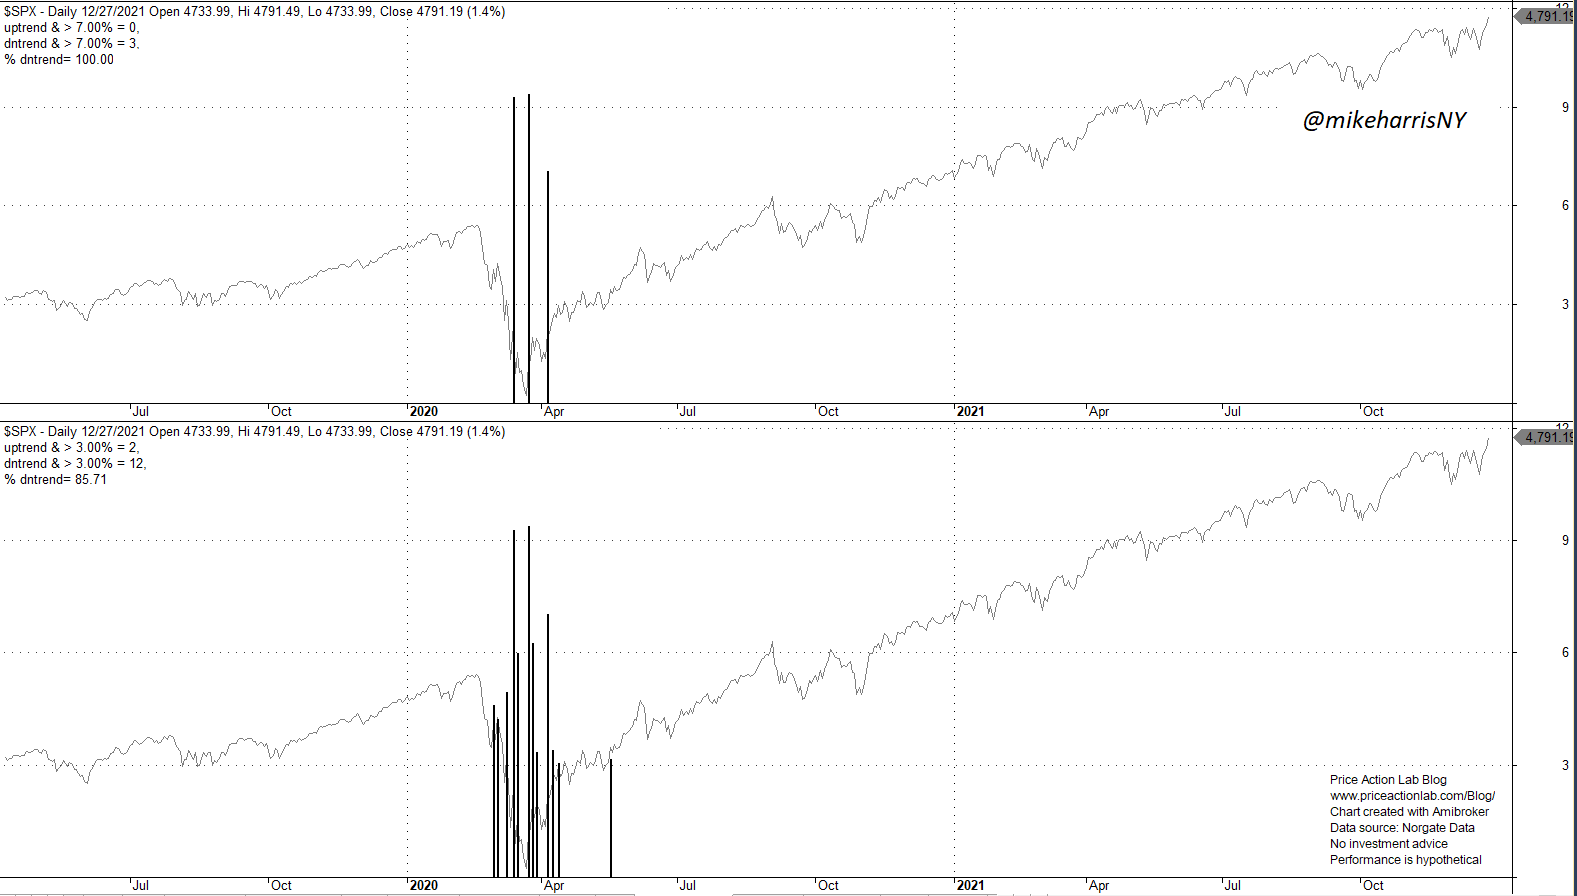
All three daily returns larger than 7% have occurred near the bottom of last year’s crash and while there was still a downtrend, as defined above.
More interesting is the fact that 10 of the 12 daily returns larger than +3% have occurred along the downtrend due to the market crash that started in February of last year and only two have occurred along the uptrend due to the rebound.
More importantly, there has been no daily return larger that +3% after May 2020 although the S&P 500 has gained 67%.
Below is the same chart since about 1993 with same definitions applying.

All six daily returns larger than 7% have occurred along downtrends or near bottoms of bear markets.
In addition, 75 of the 87 daily returns larger than +3% have occurred along downtrends, or near bear market bottoms; that translates to 86.2%.
Most traders know large daily returns are due to short covering rallies. These are rare along uptrending markets at low volatility.
Furthermore, the above statistics show why buying out-of-the-money call options near expiration in hope of a market rally is highly unprofitable.
Price Action Lab Blog Wishes You a Happy New Year!
Charting and backtesting program: Amibroker. Data provider: Norgate Data
If you found this article interesting, you may follow this blog via RSS or Email, or in Twitter.


