


The sell side has been persistent lately in trying to convince investors that market breadth has deteriorated and only a small number of stocks are driving the indexes. The data show this is false. Possible motive of sell side is discussed.
As I wrote in another article earlier this month, persistent efforts to convince investors that only a few mega caps have been the drivers of the bull market directly collide with facts. Specifically, the claim that only five stocks have been driving the S&P 500 higher this year is false. This can be seen from the relative performance chart of S&P 500 and its equal weight counterpart.
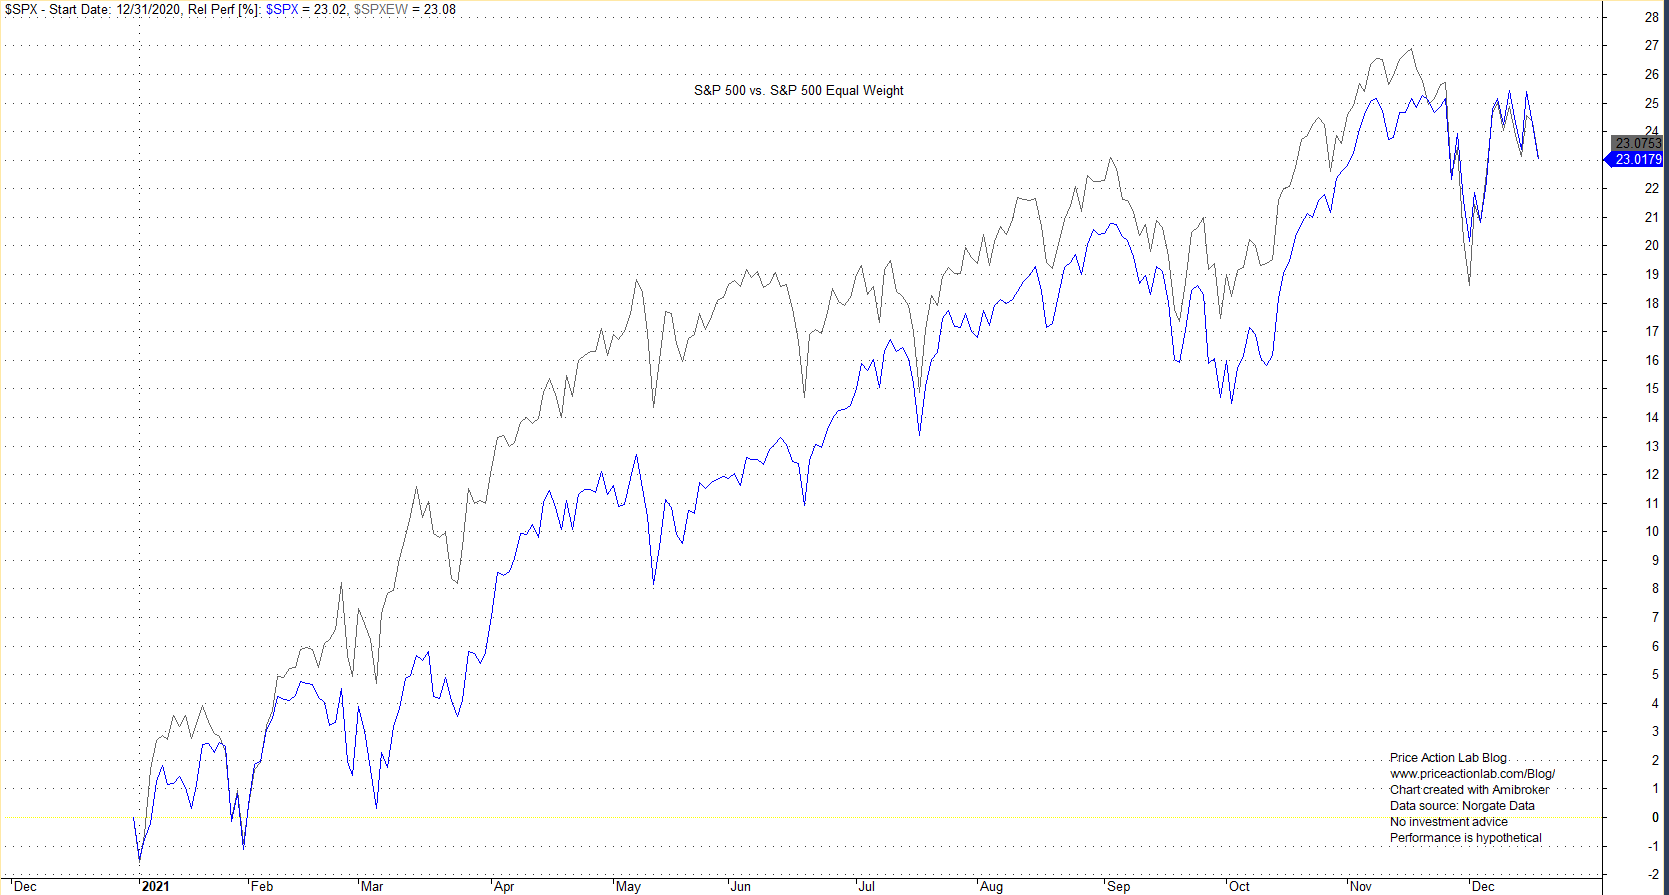
Year-to-date, the S&P 500 is up 23.07% while the equal weight version is up 23.02%. There is nothing here to support the relentless bombardment of financial social media with the claim that five stocks have been driving the index up this year. In fact, equal weight outperformed the cap weighted index until mid November.
As of the close of this week, the average year-to-date performance of the top 10 stocks by return in S&P 500 is 134.6% while the average for top ten stocks ranked by market cap is 44.1%. These two groups have only one stock in common: NVDA. For example, AMZN is up only 4.4% year-to-date while the lowest performance of the top 10 stocks by year-to-date return is 113.4% for NVDA. The top performing stock by year-to-date return is MRNA at 182.2%.

The sell side is desperate because as prices continue to move higher, transaction volume usually falls because investors follow the trend. For volume to increases, a sharp correction is required with investors selling and then after a while buying back what they have previously sold. This translates to revenue for the sell side. In my opinion, this is the main reason the sell side is frequently trying to rationalize potential top formations. Overall they are ignored by market participants because nowadays investors and traders have more choices for their source of information.
Disclaimer: No part of the analysis in this blog constitutes a trade recommendation. The past performance of any trading system or methodology is not necessarily indicative of future results. Read the full disclaimer here.
Charting and backtesting program: Amibroker. Data provider: Norgate Data
If you found this article interesting, you may follow this blog via RSS or Email, or in Twitter.


