Fact check result: true but conditioned on details. Common interpretation is false. Read below for details.
In last few weeks there have been numerous references to the claim that a large fraction of S&P 500’s year-to-date return has come from only five stocks.
Fact check: The claim is true but provided we take into account it refers to the capitalization weighted index.
Why does this matter?
It makes a huge difference because most of those who have heard the claim run to the false conclusion that the stock market has been driven by those five stocks.
Fact check: The common interpretation is false. Below are the details.
The table below shows the top 10 stocks in S&P 500 by market capitalization as of December 10, 2021.
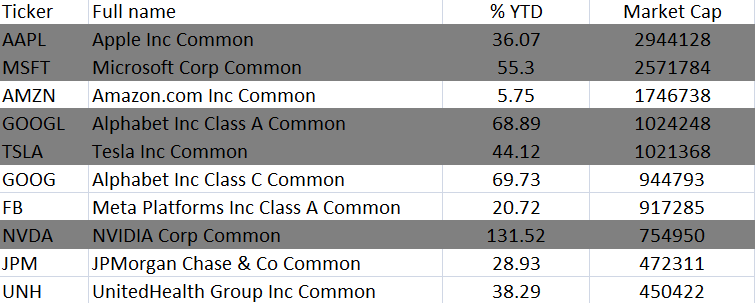
Most claims we mentioned center around the fact that the highlighted five stocks in the above table, i.e., AAPL, MSFT, GOOGL, TSLA and NVDA, have generated 35% of S&P 500’s year-to-date rerun.
Of course this is true and we don’t need to redo calculations here. But the common interpretation is false. True and false yield false.
The average return of the above five stocks is 67.2%. This is nearly 2.64 times the return of the cap weighted S&P 500 year-to-date. But let us look at the top ten stocks by year-to-date return below.

The average return of the top five stocks is 158.3% or nearly 6.22 times the return of the cap weighted S&P 500 year-to-date.
In fact, only one of the stocks claimed to be driving the S&P 500 year-to-date is in the above table of top ten, namely NVDA.

Fact check: The market has not been driven by only five stocks year-to-date.
What is the truth then?
The truth is that a cap weighted index is not representative of drivers of returns in the market. While some large caps stocks have disproportional impact in cap weighted index, some other lower cap stocks have disproportionate impact in the equally weighted index.
What is an equally weighted index?
Equal weighting randomizes economic factor mispricing as well as prevents a few large companies from driving the index’s performance.
— Source: FTSE RUSSELL website
So as it happens year-to-date, the common narrative is false and designed to cause sensation as usual. Below is a chart of relative performance of S&P 500 cap weighted and equally weighted indexes.
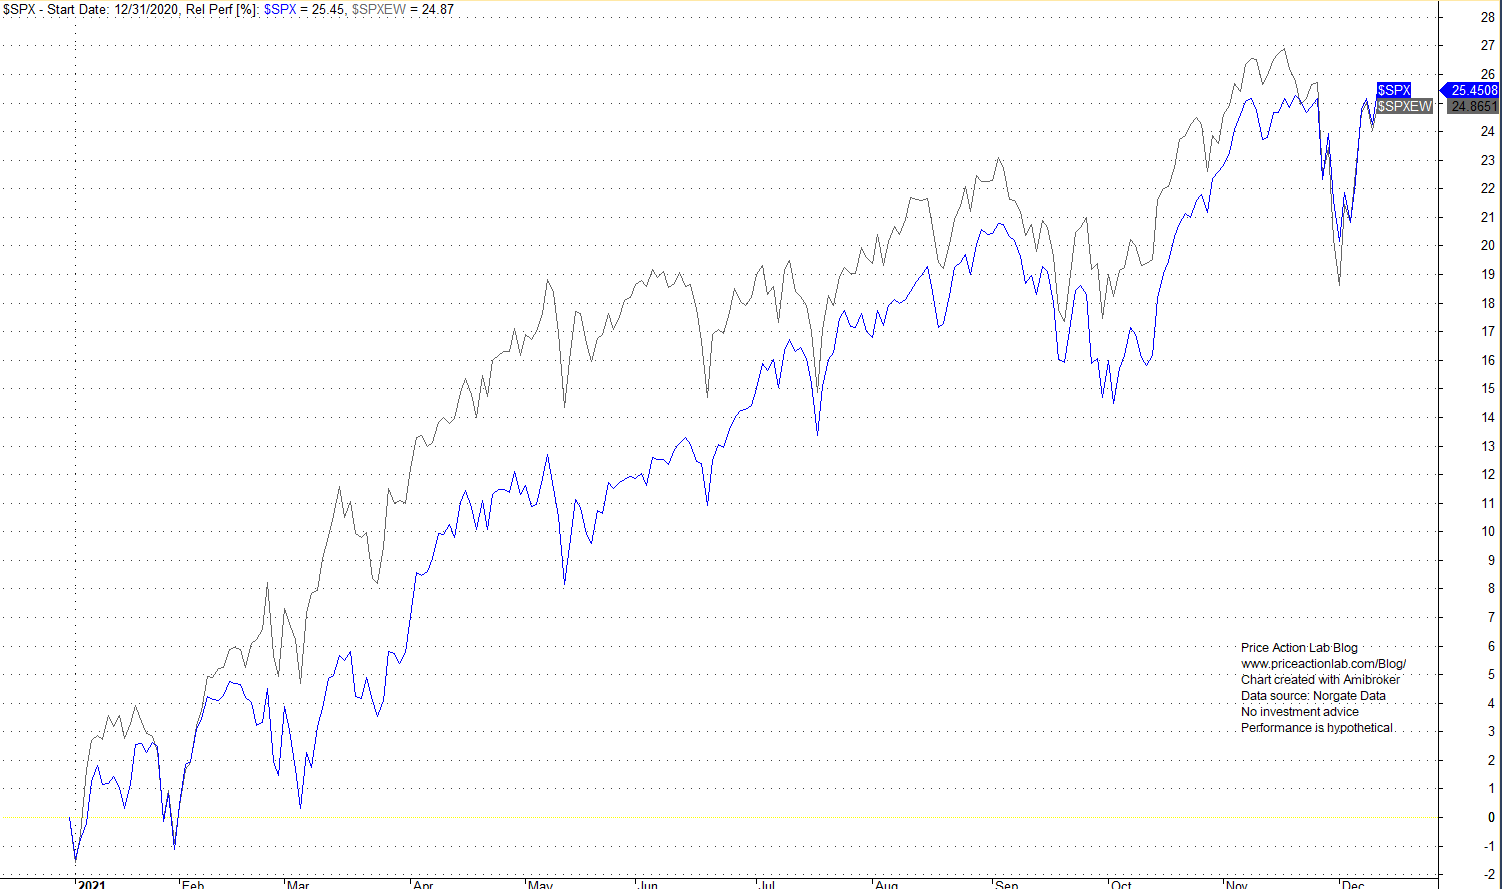
This chart shows that S&P 500 is up 25.5% year-to-date while the equal weight version of the index is up 24.9%. Moreover, until recently, equal weighting has outperformed the cap weighted index.
Fact check completed. Results:
The claim that 35% of S&P 500’s year-to-date returns has come from five stocks is true provided
- We take into account it refers to the capitalization weighted index.
- We do not imply these five stocks drive the whole market.
Charting and backtesting program: Amibroker. Data provider: Norgate Data
You may follow this blog via RSS or Email, or in Twitter. Disclaimer
10% off for blog readers and Twitter followers with coupon NOW10