


Bitcoin correlation with equities has been on the rise since September of last year. Commodities correlation with equities remains high but they offer some diversification for fixed income portfolios.
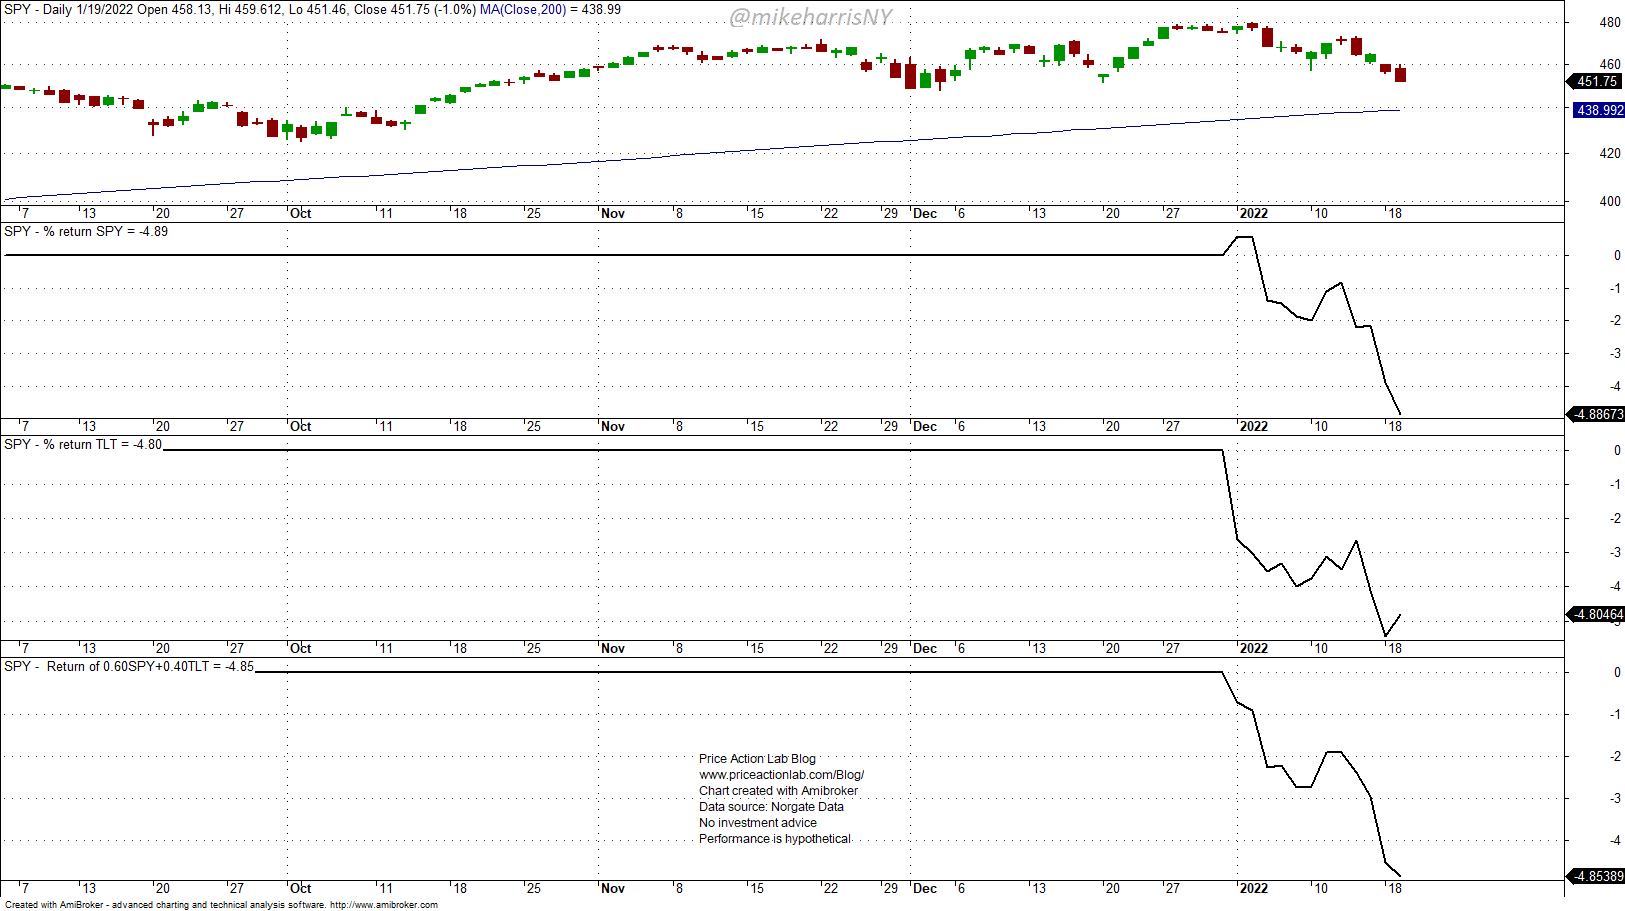
Year to date, stocks (SPY) are down 4.9% while bonds (TLT) are also down 4.8%. As a result, the 60/40 portfolio in SPY/TLT is down 4.8% year-to-date.
Some fund managers have added bitcoin to their holding in hope it will provide some diversification but in addition to the high volatility, the correlation between this digital asset and stocks has increased since September of last year, as shown below.

The 0-lag, 60-day correlation between Vanguard Total Stock Market ETF (VTI) and Bitcoin futures (BTC) has risen from a low of about 0 in September 2021 to +0.44 and in fact has never fallen below 0 since last year.
Note that correlations are random variables and change constantly depending on investor behavior. Therefore, the dynamic shown in the above chart can always change.
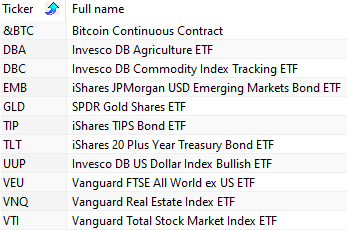
Below is a list of assets and their 60-day correlation matrix.
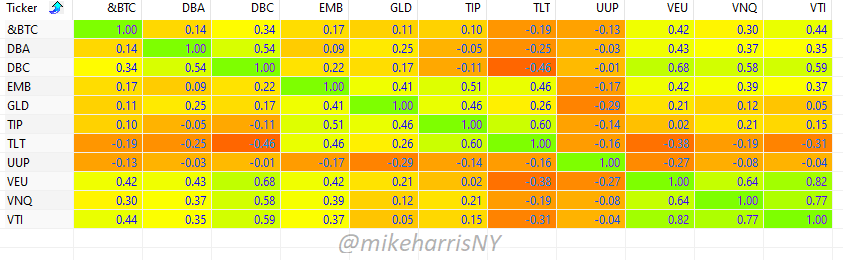
Commodities (DBC) are anti-correlated with Bonds (TLT) at -0.46. This is shown in the chart below.
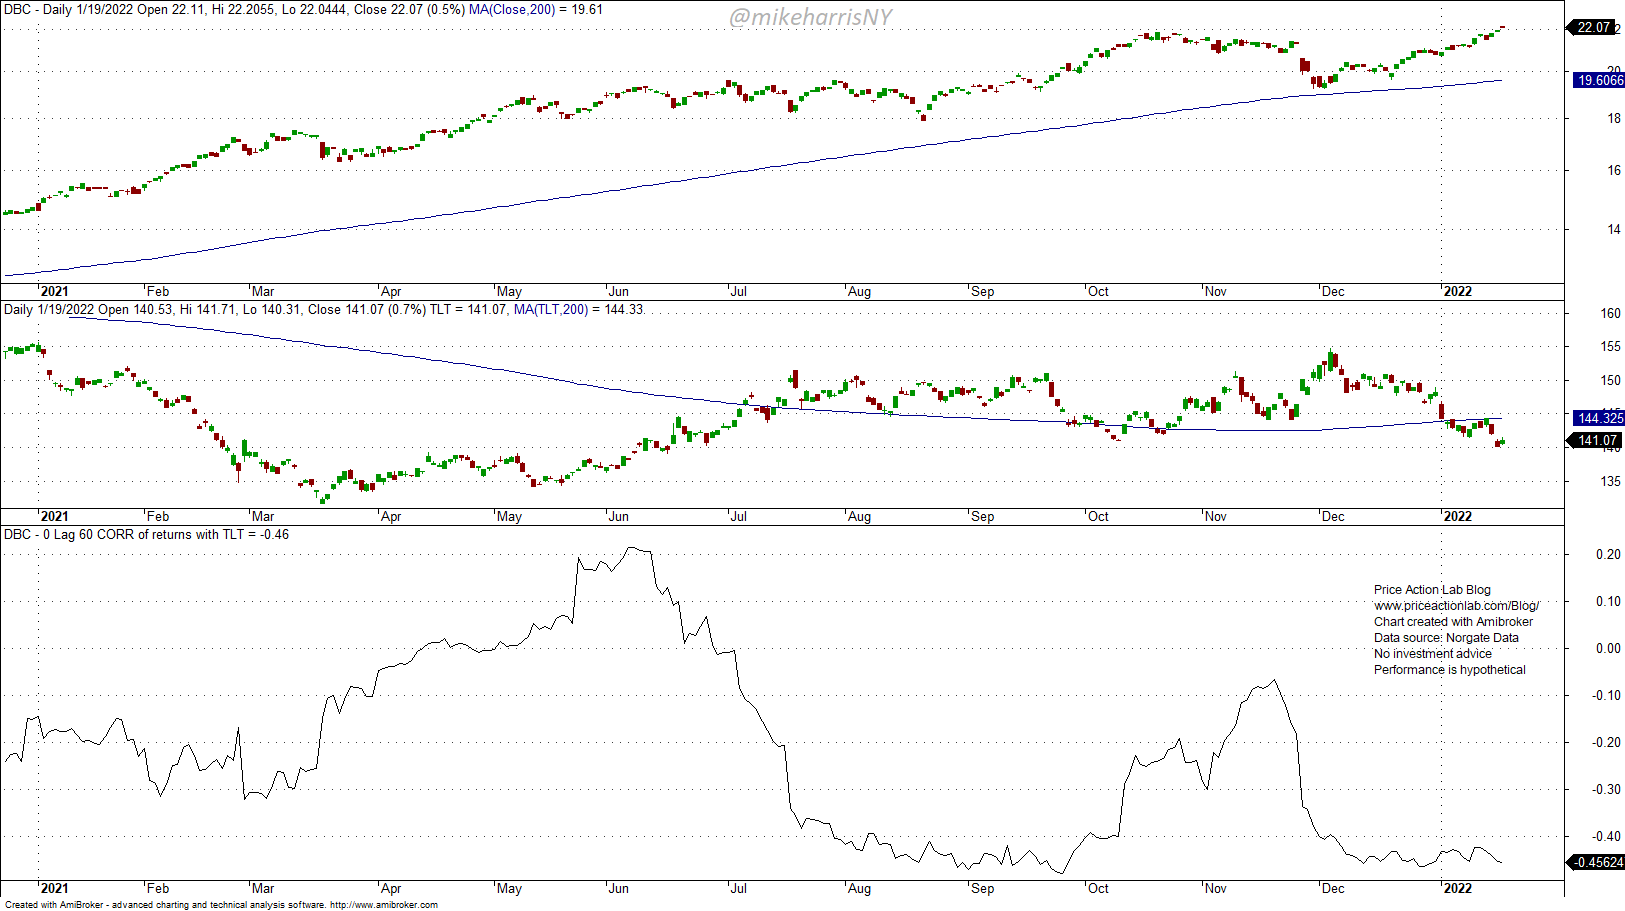
In this case the anti-correlation is also obvious from the chart and commodities have provided diversification for portfolios. Note that DBC ETF price action is heavily influenced by price action in crude oil. In fact, the 60-day correlation of DBC and USO is at 0.96!
Also note from the above correlation matrix that all assets considered are highly correlated with stocks except bonds (TLT) that show a small anti-correlation that is probably about to vanish and US dollar index (UUP) that shows no correlation.
The conclusion is the only diversification that is currently functional is commodities providing some hedge for bonds.
Premium Content 10% off for blog readers and Twitter followers with coupon NOW10
Disclaimer: No part of the analysis in this blog constitutes a trade recommendation. The past performance of any trading system or methodology is not necessarily indicative of future results. Read the full disclaimer here.
Charting and backtesting program: Amibroker. Data provider: Norgate Data
If you found this article interesting, you may follow this blog via RSS or Email, or in Twitter.


