


Permabears have used in the past various arguments and charts in an effort to convince investors equity markets and economies will crash. The latest campaign involves long-term consumer price index charts.
Before quantitative easing, most permabears used technical analysis and chart patterns in support of their arguments of collapsing stock markets. They would draw lines on log charts or invent some “head and shoulders” or “triangle” pattern on weekly or even monthly charts that supposedly indicated a major collapse.
After the global financial crisis of 2007 – 2008, most permabears have focused on inflation scare. They predicted hyperinflation due to quantitative easing and used myriads of arguments to convince investors stocks would crash. Nothing like that happened and instead stocks continued to rise driven mainly by innovation in the technology sector.
The latest scare campaign involves Consumer Price Index charts going back several centuries. The charts are used out of context as we will see below. The following, or variations of it, has recently appeares in social media.

This is the usual line of permabears but also some gold bugs : “Prices were stable for several centuries but something happened after 1971.”
Then they say the abolishment of the gold standard in 1971 was the reason of skyrocketing prices and debasement of the US dollar.
The conclusion is this is unsustainable and will lead to collapse unless we return to gold standard or equivalent. Crypto proponents intervene and claim the alternative is a cryptocurrency.
My counter-argument is: “If you had a time machine, would you go back to 1800 to live?”
Progress is not cheap; it comes at a price and that is among other things inflation. However, as long as the assets progress creates are valued more than inflation, this is a preferable path than when Kings and Feudalists owned most of gold and the majority of population were peasants involved in barter trade. I don’t think many who are in favor of returning to a gold standard understand this.
This isn’t to say the fiat system doesn’t have any problems but “it’s the best of all possible worlds.” The fiat system comes with structural boom and bust cycles: boom causes inflation and bust causes deflation. But as long as what is gained during the boom cycles is worth more than what is lost during the bust cycles, in my opinion this is a preferable system by far.
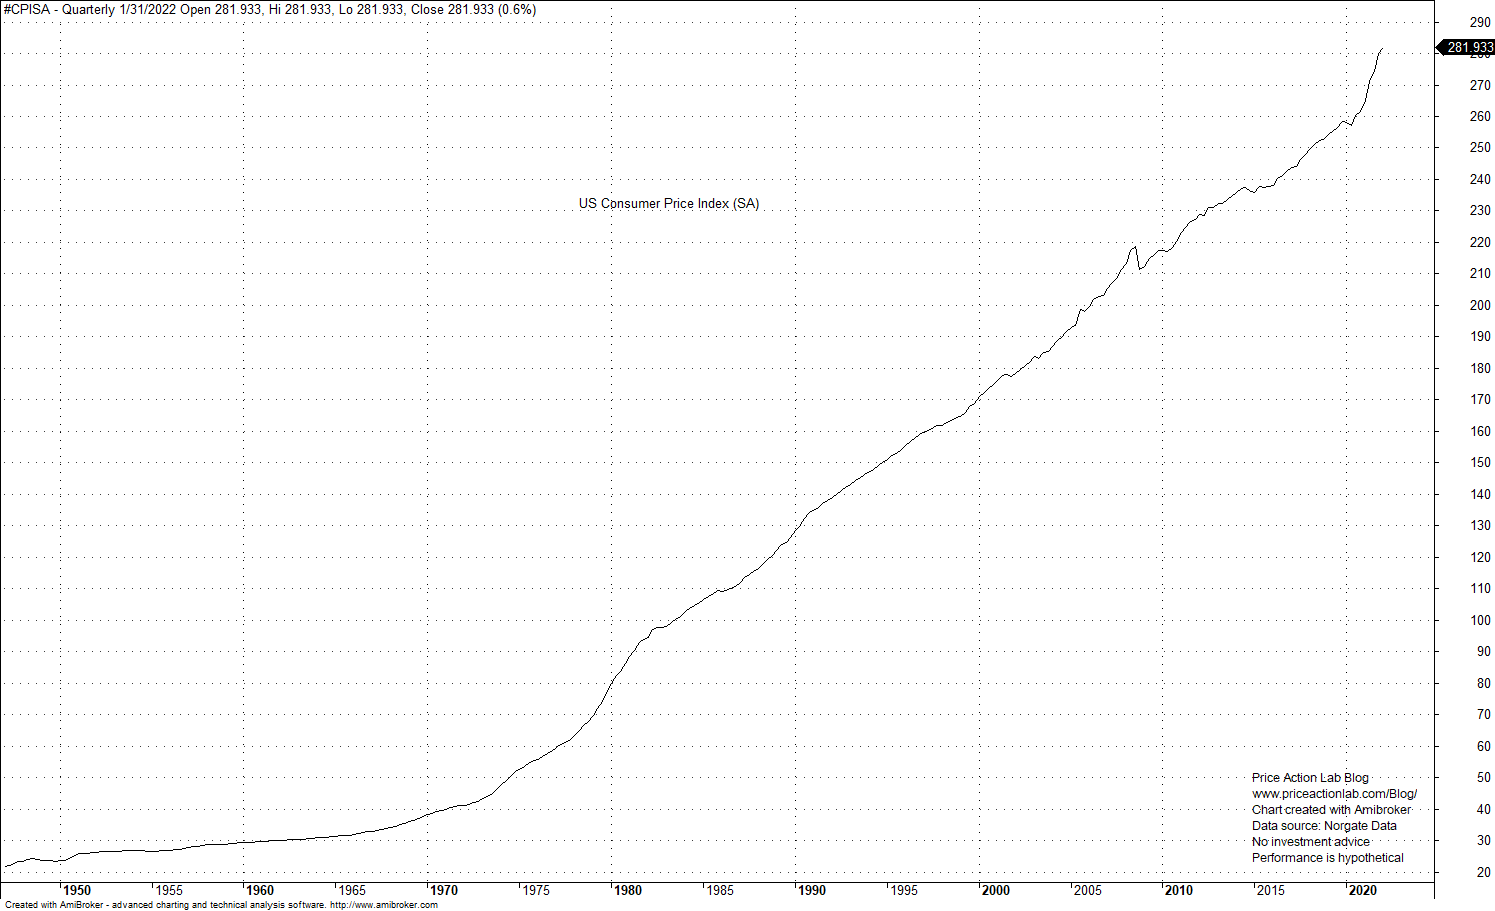
Let us look at a few more charts and numbers below. The CPI chart since 1947 (linear scale) looks terrible and scary out of context.
Below is a relative performance chart of CPI and S&P 500 (no dividends) in same period.
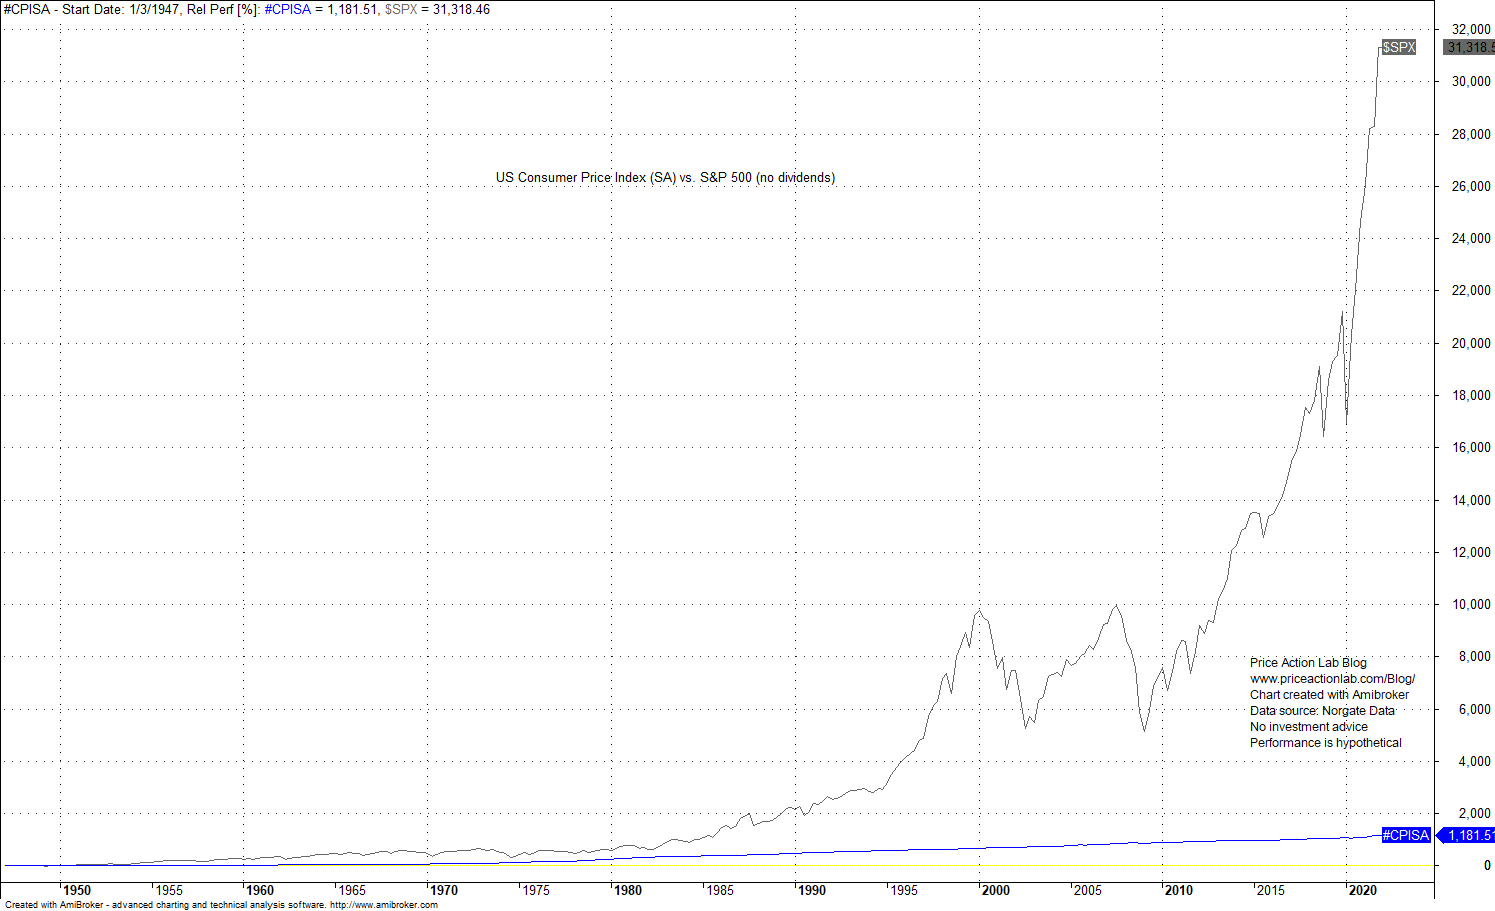
The CPI is up 1,182% but the S&P 500 is up 31,318% in the same period!
Stocks have gained an order of magnitude more by using inflation to their benefit. This doesn’t even include dividends that make a good fraction of performance.
Below are compound annual growth rate (CAGR) calculations for S&P 500 total return using data from Robert Shiller since 1871.
| Before Inflation | Inflation Adjusted | |
| CAGR | 9.3% | 7% |
The calculations show that the S&P 500 (equivalent before 1960) has grown at a net annual rate of 7% after adjusted for CPI.
Therefore, the abolishment of the gold standard has paid off. However, not for all people. There is very high inequality. But this is a different problem. This isn’t a problem of the Fed and they didn’t cause it. It’s structural in human society.
Returning to gold standard or adopting cryptocurrencies won’t solve inequality and may even make it a lot worse. One thing is certain: inflation will disappear and along with it innovation (not theories but practice and application), growth and progress in general.
Premium Content 10% off for blog readers and Twitter followers with coupon NOW10
Disclaimer: No part of the analysis in this blog constitutes a trade recommendation. The past performance of any trading system or methodology is not necessarily indicative of future results. Read the full disclaimer here.
Charting and backtesting program: Amibroker. Data provider: Norgate Data
If you found this article interesting, you may follow this blog via RSS or Email, or in Twitter.


