


The S&P 500 had four consecutive up days with gains of more than 1% this week. Since 1942 this has occurred only five times. There is the right and the wrong way of looking at this pattern and also similar patterns that occasionally form.
Rare patterns have small samples and any inferences drawn from them have low or no statistical significance. Backtesting these patterns usually leads to random results, or even getting fooled by randomness.
However, there is another way of dealing with rare patterns: context. Let us look at the particular pattern of four up days in S&P 500 with gains of 1% or higher.
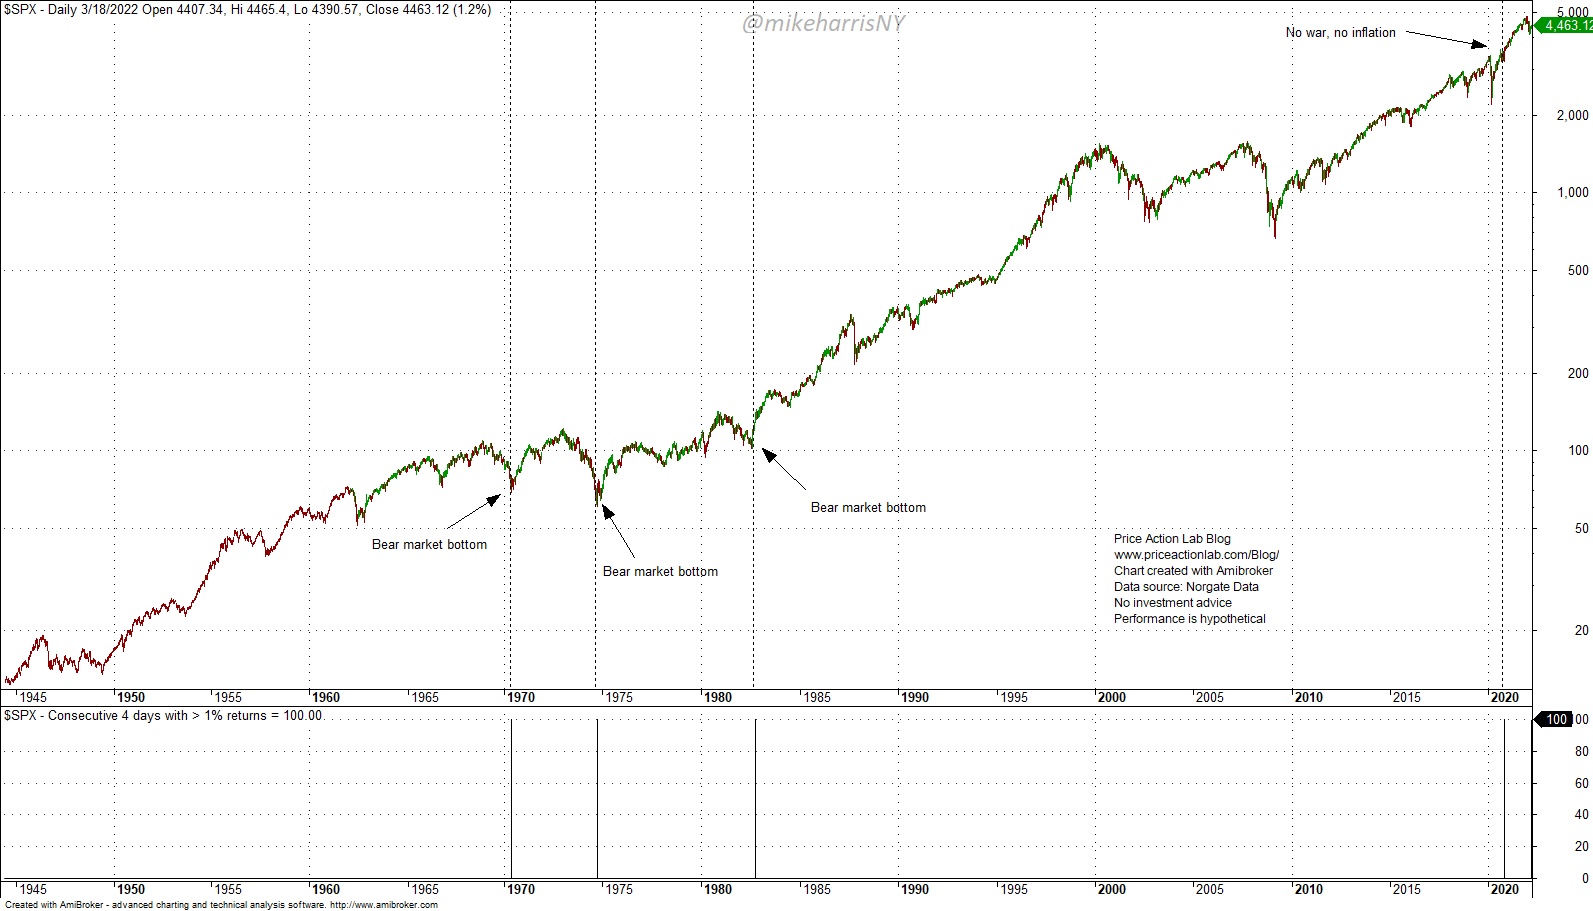
The vertical lines on the bottom chart indicate the formation of the pattern on the time axis. There are five of them with the last one formed as of the close of this week.
The first three, two in the 70s and one in early 80s, share a common feature: they formed at the bottom of bear markets, as shown in the above chart. The fourth one was formed along the uptrend that started after the pandemic crash. The current one was not formed at the bottom of a bear market or along an uptrend but after a correction.
As you can see, these patterns, or specific events in probability theory terminology, do not arise from the same experiment, to use another technical term. In other words, if we had zillions of data for the S&P 500, there would be probably many groups of this particular pattern: one group formed at the bottom of bear markets, another group formed along uptrends, another group formed after small corrections, maybe another group that appears to form randomly, etc.
Although these patterns share a common property of four up days with gain of more than 1%, they also have other properties in the form of hidden variables.
It doesn’t even make sense to compare them without looking at those possible hidden variables, or conditions, and any inferences made are not significant regarding the last one. In fact, the last one is a sample of one.
Some analysts looked only at three consecutive days in an effort to increase the sample size and they offered backtests they argued show forward gains for the market for some holding periods.
These analysts were (again) fooled by the long-term upwards bias of the market, which can be seen by someone not even skilled in the art of technical analysis.
If you take any random pattern and hold a long position for a year, the win rate will be very high by virtue of the upward bias. I don’t even need to present a simulation of this because it’s common sense but I think I’ve done this in another article in the past.
What those naïve backtests miss, or fail to consider, is the Maximum Adverse Excursion (MAE) of such trades after the signals and whether they can cause uncle point, or even ruin to a trader.
Below is a backtest for long positions in S&P 500 (hypothetical) after three consecutive up days with gains of more than 1% and exit after 120 days.
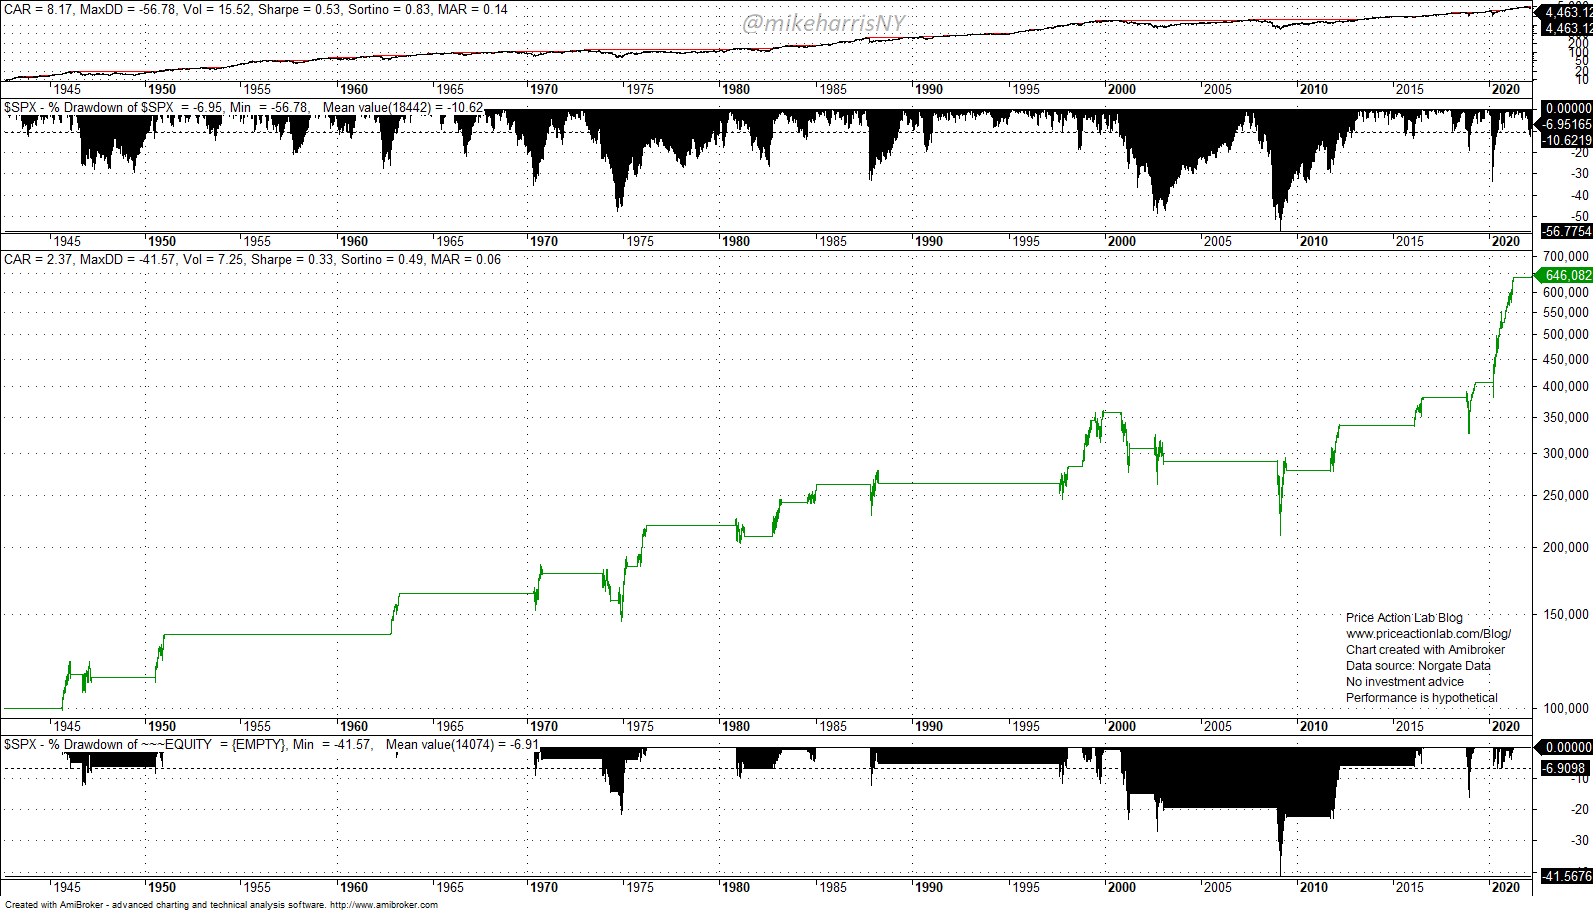
From about 2000 to 2010 the drawdown is more than 20% and peaks at 41.6% in 2009. This pattern isn’t as innocent as it looks when someone considers only the win rate, which is 75% and considerably high. This means some trades occurred before large corrections or bear markets.
For 220-days holding period, the drawdown profile is even worse, although the win rate increases to 86.4%.

In this case there are two long drawdown periods as shown in the above chart. Although most trades are winners, some of them can cause pain, uncle point or even ruin depending on leverage.
In social media people display statistics on a daily basis just with the dates some patterns occur and the historical gains but almost never the MAE of those trades. Why? Because that is no good for the narrative.
Another notorious issue with pattern statistics is that they are mostly used in support of a certain market view and any patterns that oppose the view are not considered, or presented. This is the selection bias problem that renders most analysis in social media noise. People will present what they like and avoid what they don’t. Analysts with no bias can offer a long-term edge but it’s hard to identify them. It’s also hard for people to have simultaneously a position and a view against it.
If you found this article interesting, you may follow this blog via RSS or Email, or in Twitter.
Premium Content 10% off for blog readers and Twitter followers with coupon NOW10
Disclaimer: No part of the analysis in this blog constitutes a trade recommendation. The past performance of any trading system or methodology is not necessarily indicative of future results. Read the full disclaimer here.


