


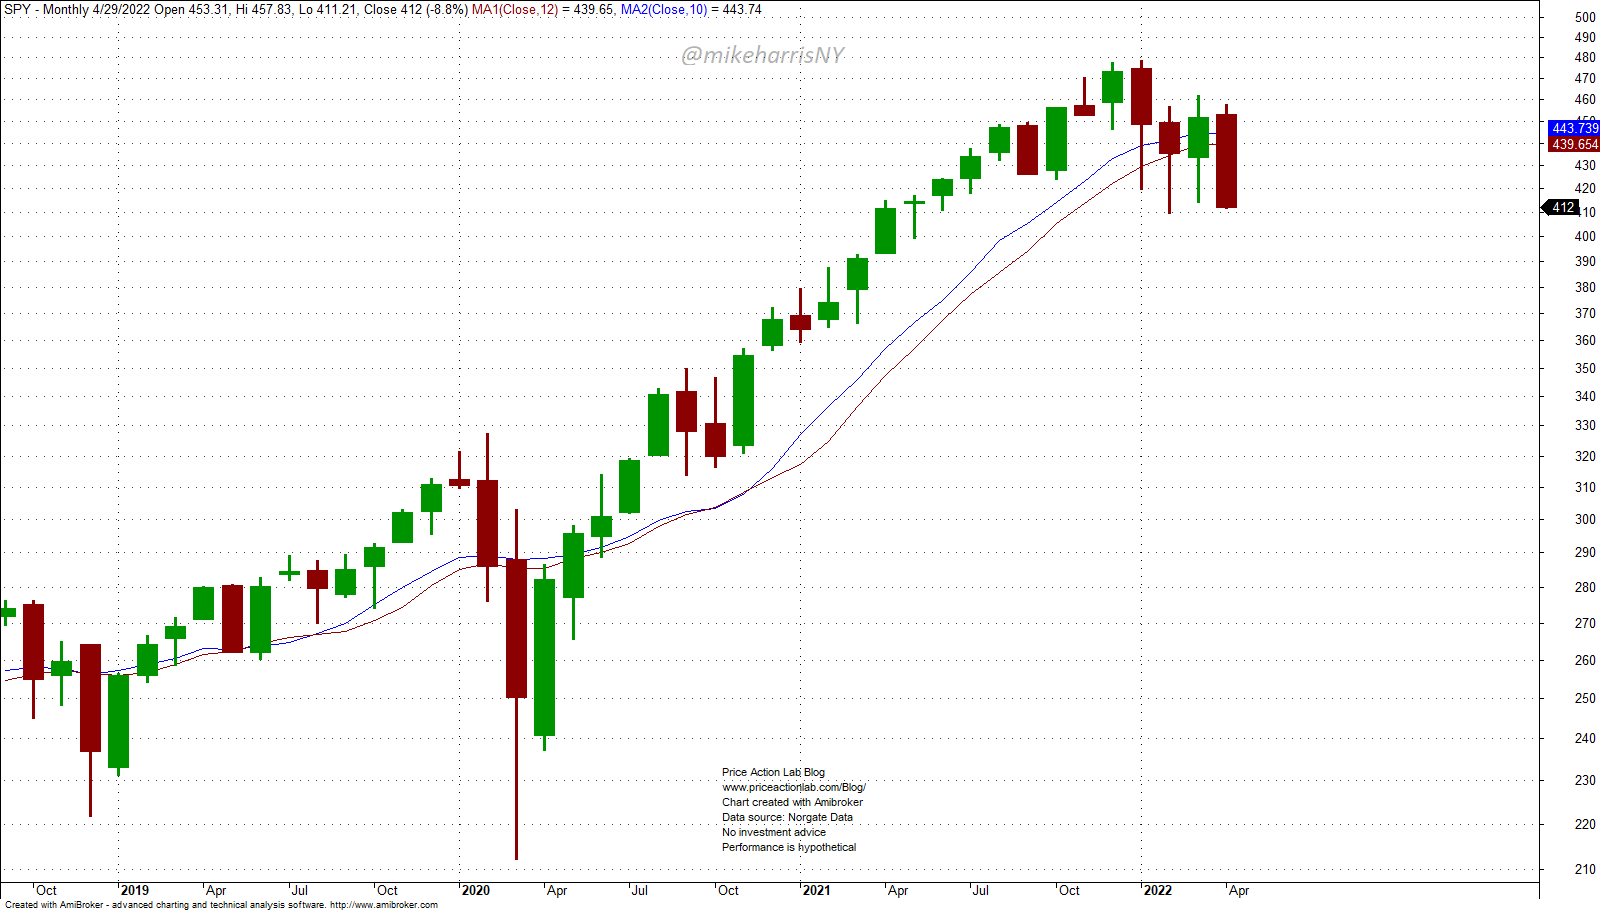
On the last trading day of this month, the S&P 500 and SPY ETF ended below the 10-month and 12-month moving averages, contributing to the stock market’s sell-off.
The 10-month and 12-month moving averages are widely used momentum indicators. On the last day of April, both the S&P 500 and the SPY ETF closed below those two key moving averages. This might have accelerated the sell-off, as many momentum traders might have elected to rebalance their portfolios before the market closed and also before the open of the next month.
This is a hypothesis, but it’s a reasonable one given how popular the indicators mentioned above are. Below is the monthly SPY ETF chart with the two moving averages, the 10-month and 12-month.
A backtest of the price series long-only momentum strategy that goes long at the next monthly open when the price is above the 12-month moving average and exits at the next monthly open when the price falls below the average reveals the following yearly performance.
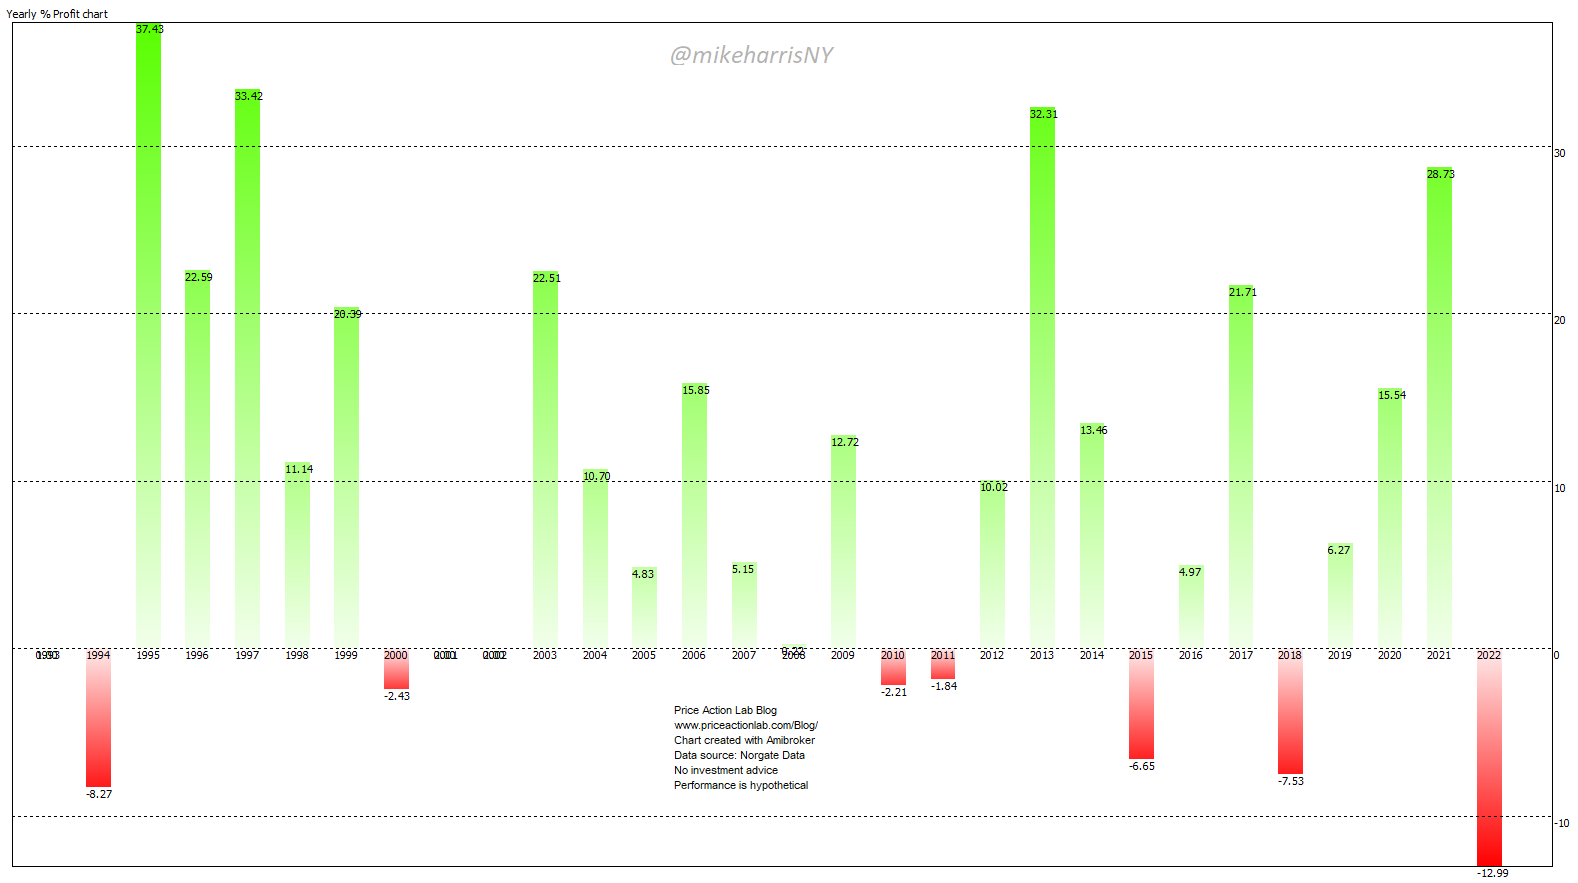
Note the large year-to-date loss when compared to previous yearly losses. However, we don’t know yet the actual performance for the year, and this loss may reflect a drawdown. The drawdown profile of this price series momentum strategy is shown below.
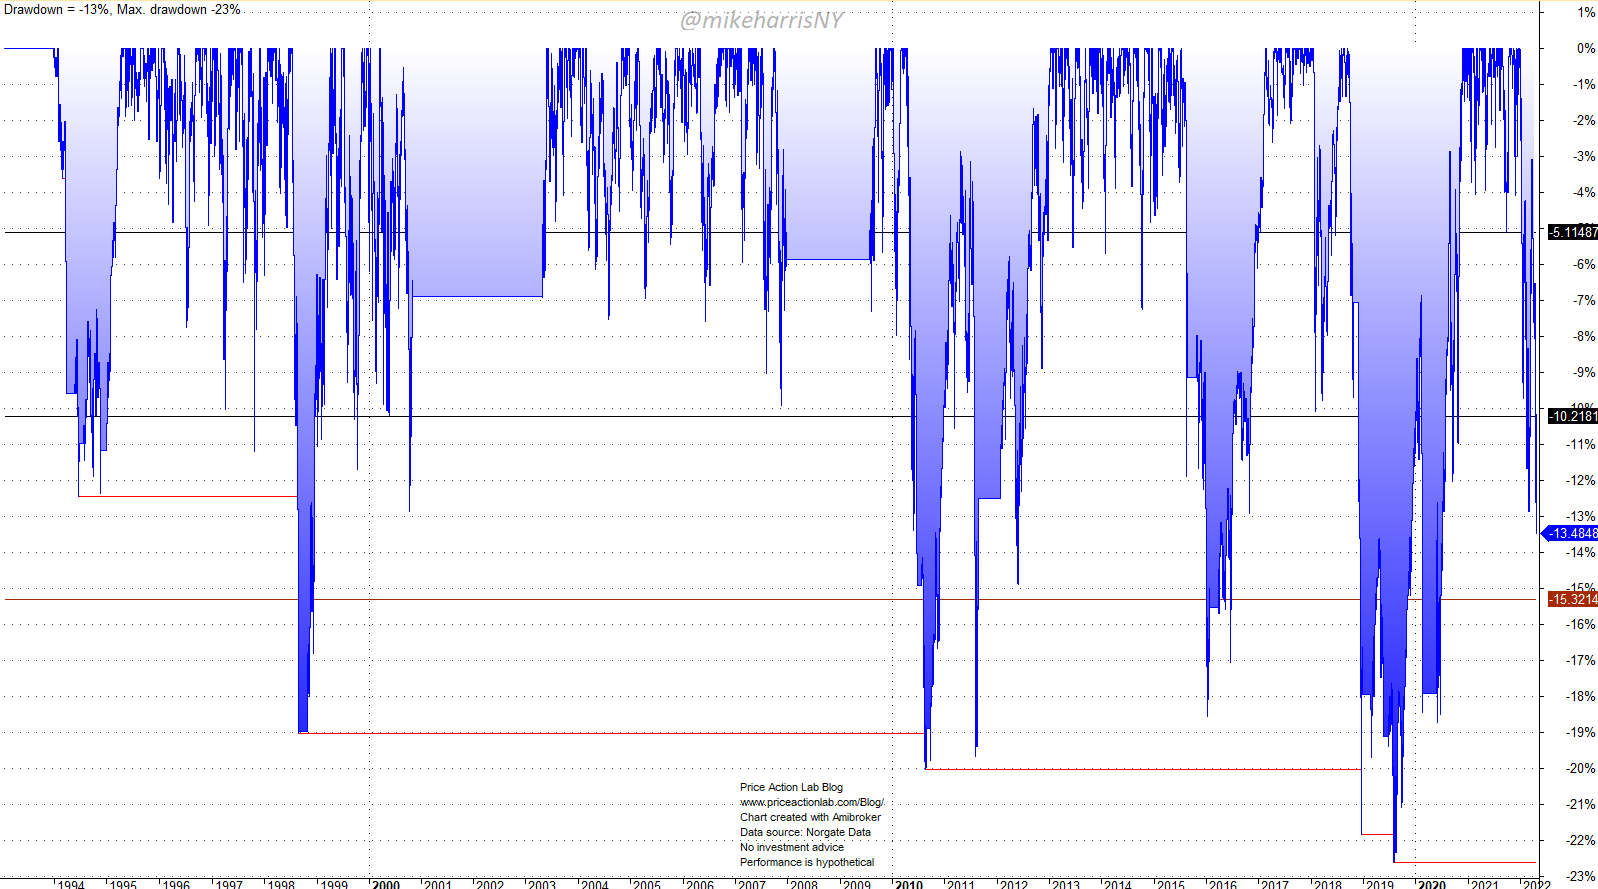
The drawdown profile is calculated based on daily prices rather than monthly, as in many financial blogs or even academic papers.
The average drawdown has been -5.1%. One standard deviation is at -10.2% and two standard deviations are at -15.3%. The current drawdown is -13.5% and the historical maximum is -23%.
The price series momentum strategy based on the 12-month moving average has been relatively robust in delivering higher risk-adjusted returns over the years. In the case of the SPY ETF, Sharpe is 0.70 versus 0.53 for buying and holding the ETF since inception.
The main danger for a strategy like this is a prolonged sideways market, not a protracted downtrend. There have been several references to this risk in this blog. For example, see this article.
If you found this article interesting, you may follow this blog via RSS, Email, or Twitter.
Premium Content 10% off for blog readers and Twitter followers with coupon NOW10
Disclaimer: No part of the analysis in this blog constitutes a trade recommendation. The past performance of any trading system or methodology is not necessarily indicative of future results. Read the full disclaimer here.


