


If a momentum strategy could identify the absolute bottom of large corrections and bear markets, the total return could be increased by a large factor. Since we and our strategies are not omniscient, we rely on leverage and the risk that comes with it.
Amazingly, a simple strategy of a moving average with a 12-month period has nearly matched that the SPY ETF buy and hold return since inception but at lower risk.
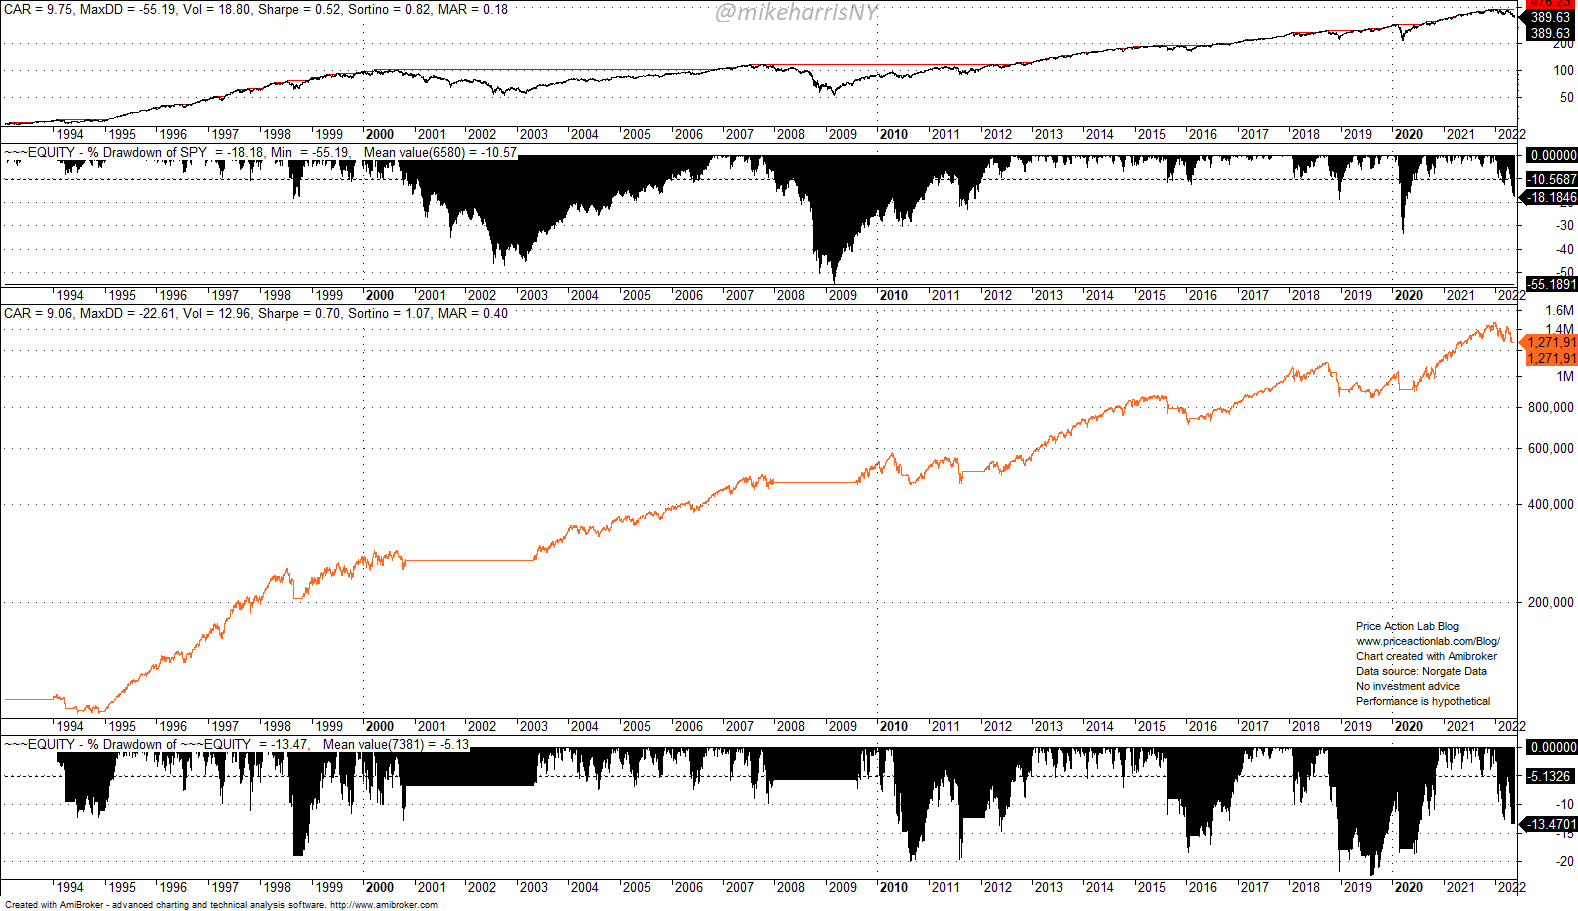
The top two charts are the daily prices of SPY ETF from inception to 05/20/2022 and the drawdown profile. The third chart is the equity of the strategy that goes long if the price is above the 12-month moving average and exits the trade if it drops below the same moving average. All trades occur at the open of the next month. Equity is fully invested. The commission is set to zero.
The simple long-only strategy has a 9% annualized return versus 9.8% for buy and hold. The maximum drawdown of the strategy is 22.6% (measured in daily timeframe), as compared to the 55.2% maximum drawdown for buy and hold. The Sharpe of the strategy is 0.70 versus 0.52 for buy and hold. Are we winning?
Not so fast! There are certain reasons this strategy has worked in the past and there are reasons why it may not work in the future, or even generate devastating losses but the subject of this brief article is momentum omniscience. Moving averages are slow in catching up with trend reversals and miss a good fraction of a developing uptrend. This happens due to the lag from smoothing prices. Below is a chart with four examples of missed profits due to the lag of the 12-month moving average.

Next, imagine an omniscient momentum trader, or strategy, that knew the exact lows in the above chart and went long instead of waiting for the moving average signal. This is a purely hypothetical situation of course to estimate the missed total return due to the lag. Below is the performance of the strategy (black equity line) compared to the original strategy (orange line).
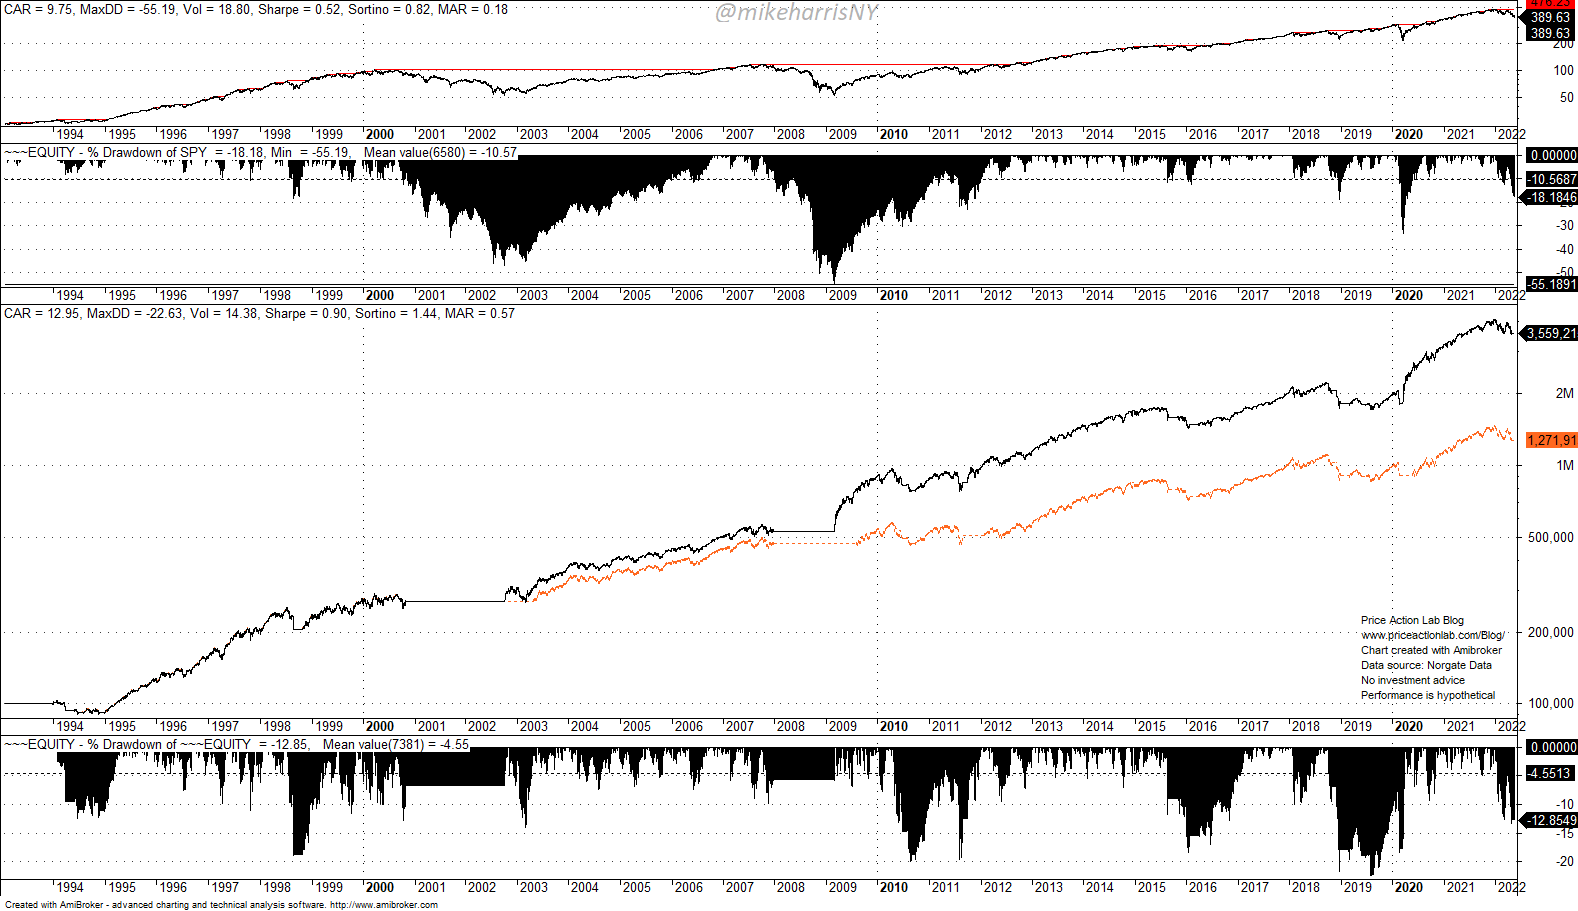
The equity of the omniscient strategy is 3,559.21 versus 1,271.91 (x1000) for the simple strategy or an increase by a factor of about 2.8. The Sharpe increased to 0.90 from 0.70. The performance is summarized in the table below.
| Simple Strategy | Omniscient Strategy | Buy and Hold | |
| CAGR | 9% | 13% | 9.8% |
| Max. DD | -22.6% | -22.6% | -55.2% |
| Sharpe | 0.70 | 0.90 | 0.52 |
| Volatility | 13% | 14.4% | 18.8% |
| MAR | 0.40 | 0.57 | 0.18 |
A 4% increase in annualized return was due to catching the lows of four corrections. The calculation could be extended to catching all lows and also exiting at the tops. But you get the idea of the significant impact of lagging indicators on total returns. Traders attempt to make up for those losses through leverage but this impacts the maximum drawdown and could lead to uncle point. There is no easy way to make up for indicator lags and watching the market rise after a major bottom while the strategy is still flat is always disappointing.
Many have tried in the past to develop indicators without lag to track price action. The price itself is a 0-lag indicator and the strategy is to buy and hold. There is no free lunch in the markets.
If you found this article interesting, you may follow this blog via RSS , Email, or Twitter.
Premium Content 10% off for blog readers and Twitter followers with coupon NOW10
Disclaimer: No part of the analysis in this blog constitutes a trade recommendation. The past performance of any trading system or methodology is not necessarily indicative of future results. Read the full disclaimer here.
Charting and backtesting program: Amibroker. Data provider: Norgate Data


