


Several charts have surfaced that claim 2008 and 2022 market price actions are similar. The charts allude to a continuing market decline.
Visual chart comparisons can be misleading. In this article, we calculate the relationship in the data and point to the weakness.
Several charts on social media and blogs have compared the recent price action since the all-time high in the S&P 500 to the price action after the high of 2007.
From January 3 to June 24, 2022, there have been 120 trading days. A fair comparison should consider the high of October 9, 2007, and the 120 trading days forward to March 31, 2008. This is shown in the chart below.
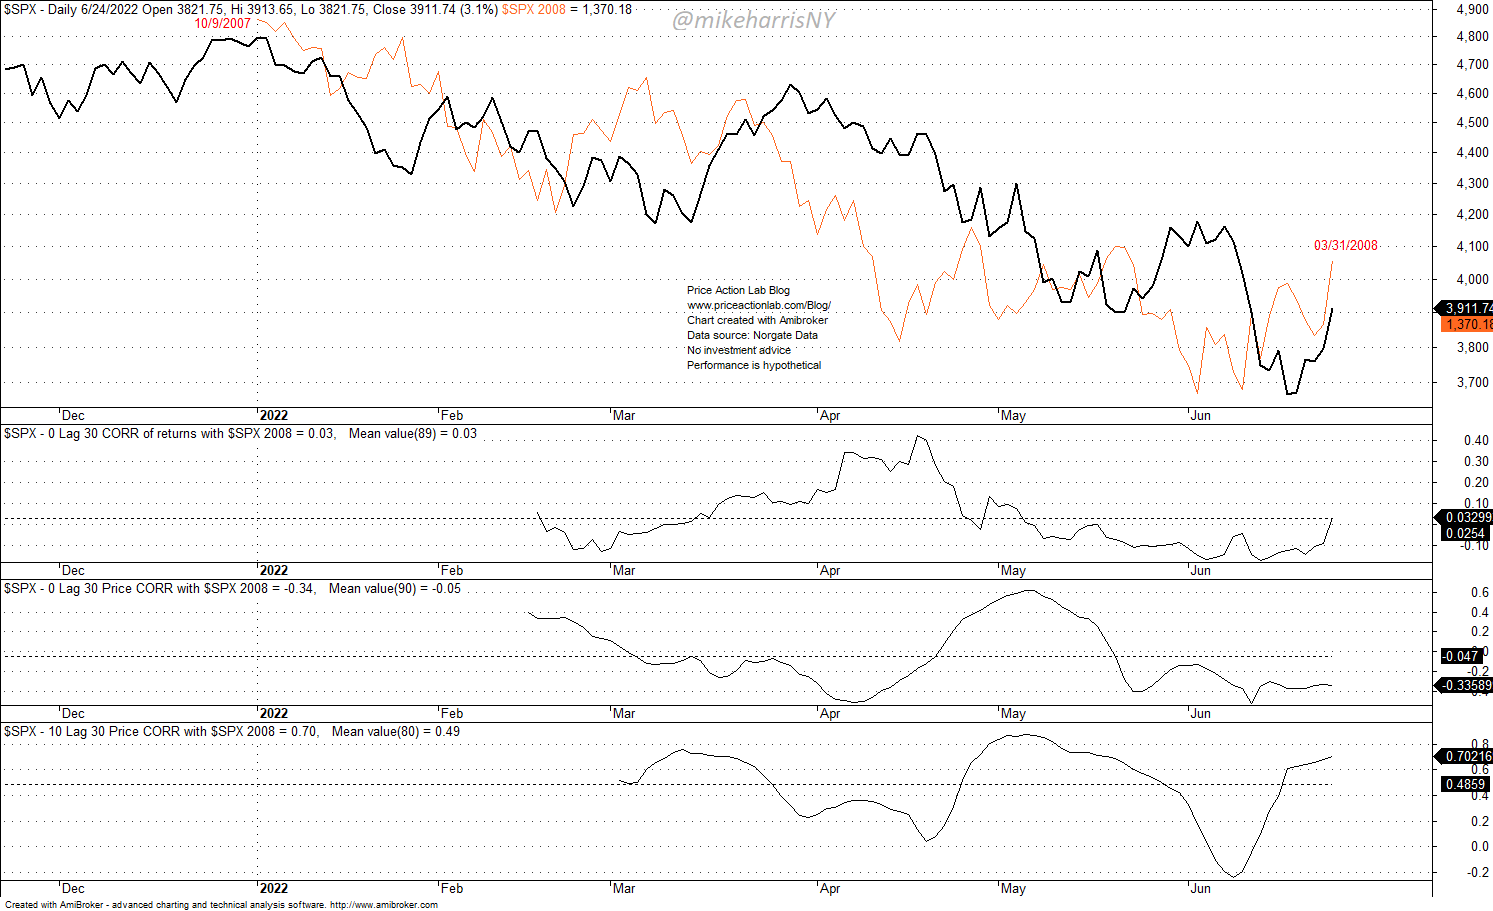
The black line is the year-to-date price action in S&P 500 index and the red line is the price action from October 9, 2007, to March 31, 2008.
The first indicator chart shows the 0-lag, 30-day correlation of daily returns of the two price series. The current value is +0.03 and the average is also +0.03. Although there have been swings, the two series are not correlated.
We also consider the 30-day price correlation in the second indicator pane. The current value is -0.34, or the two variables are anti-correlated in price. Even if we ignore some issues with using price correlation, the mean value is -0.05 and shows no correlation.
Therefore, the two series are not correlated. Can we conclude there is no relationship between the two price series?
Correlation attempts to measure the strength of a relationship between two variables. There is another more general method that attempts to measure the dependence between two variables: mutual information.
Mutual information is considered a more general measure of dependency. I used the R package MUTI to measure the mutual information (not normalized) between the two price series.
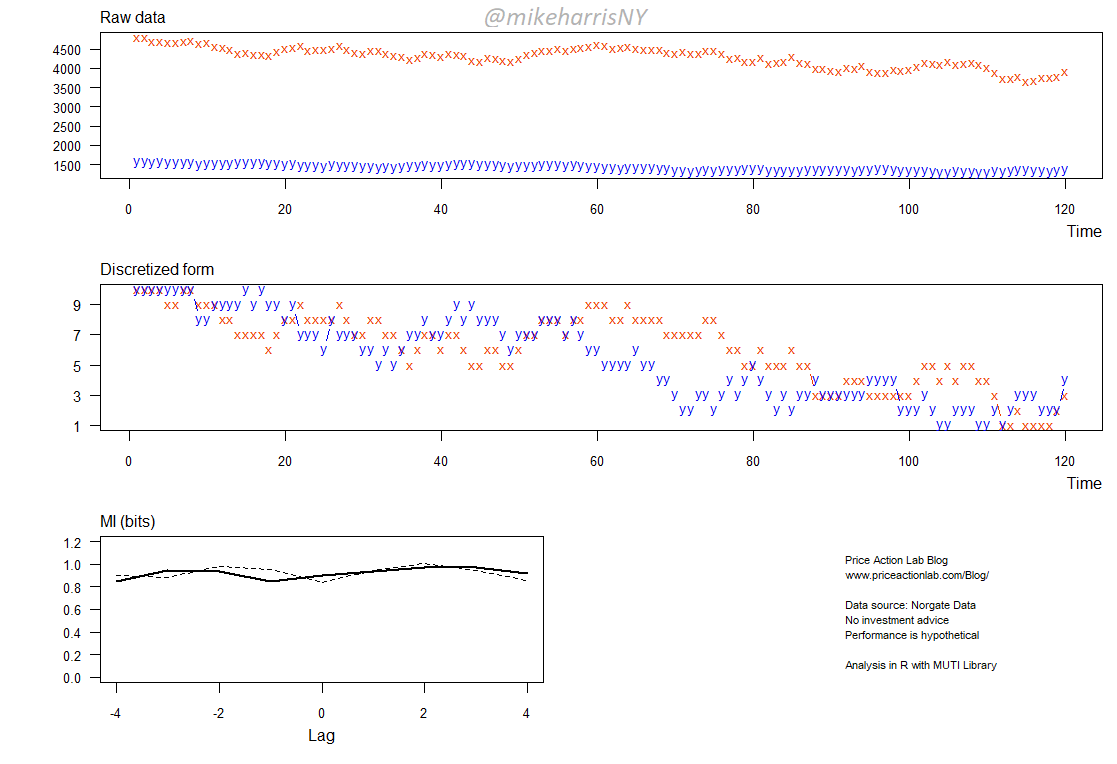
The results for lags from -4 days to +4 have values above 0.85 and about one bit. This is a high level of mutual information that reflects some strong dependency.
The strong dependency indicates a reduction in the uncertainty about one variable given knowledge of the other variable. Therefore, based on this measure of dependence, there is a strong relationship.
This means the people who have created the charts comparing 2022 to 2007-2008 are correct: there has been a strong relationship.
Here is where they are wrong: The relationship they have identified visually and we have confirmed here with mutual information is conditioned on the available past data.
In other words, the relationship can change going forward. This is due to the nature of non-stationary stochastic processes.
This is the conclusion:
- Those who have identified similarities between 2022 and 2007-2008 price action are correct.
- There is no guarantee this strong relationship will hold in the future.
- The reason for the uncertainty is the non-stationarity of the market price series.
Premium Content 10% off for blog readers and Twitter followers with coupon NOW10
Disclaimer: No part of the analysis in this blog constitutes a trade recommendation. The past performance of any trading system or methodology is not necessarily indicative of future results. Read the full disclaimer here.
Charting and backtesting program: Amibroker. Data provider: Norgate Data


