


Simple momentum has outperformed asset rotation, both long-short and long-only. Despite the underperformance this year, simple momentum has limited complexity and could continue to outperform asset rotation in the future.
Definitions for this article:
Simple momentum: Long SPY if the price is above the 12-month moving average, exit if the price falls below the moving average.
Asset rotation: Long the asset with the highest rank and short the asset with the lowest rank with monthly rebalancing. Alternatively, long-only the two assets with the highest rank with monthly rebalancing. The rank is based on the rate of change of assets in a lookback period.
Experienced strategy developers immediately notice the main problem with asset rotation: the performance depends on the choice of a lookback period. Optimizing this variable can cause over-fitting. More advanced schemes could use a variable lookback period, but any gains may not be spectacular.
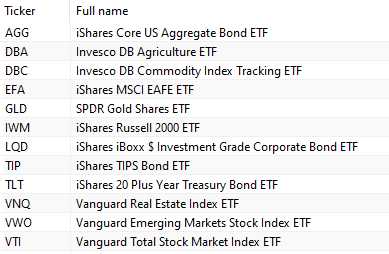
For this article, we used 12 asset ETFs. The backtest period is from 01/02/2008 to 07/29/2022. We did not include commissions in the backtests. Below is the list of ETFs.
A few days ago, in a Twitter Space presentation, the invited speaker suggested a particular long-short asset trade based on a 12-month rate-of-change indicator (rank). It was clear to me that the analysis of the speaker suffered from recency bias, and the speaker has not done any backtests. As it turns out, this particular long-short asset rotation strategy has worked nicely this year, but it has been hopelessly unprofitable in the backtest period. The speaker’s call was motivated by wishful thinking and not by sound analysis.
1. Long-short Rotation
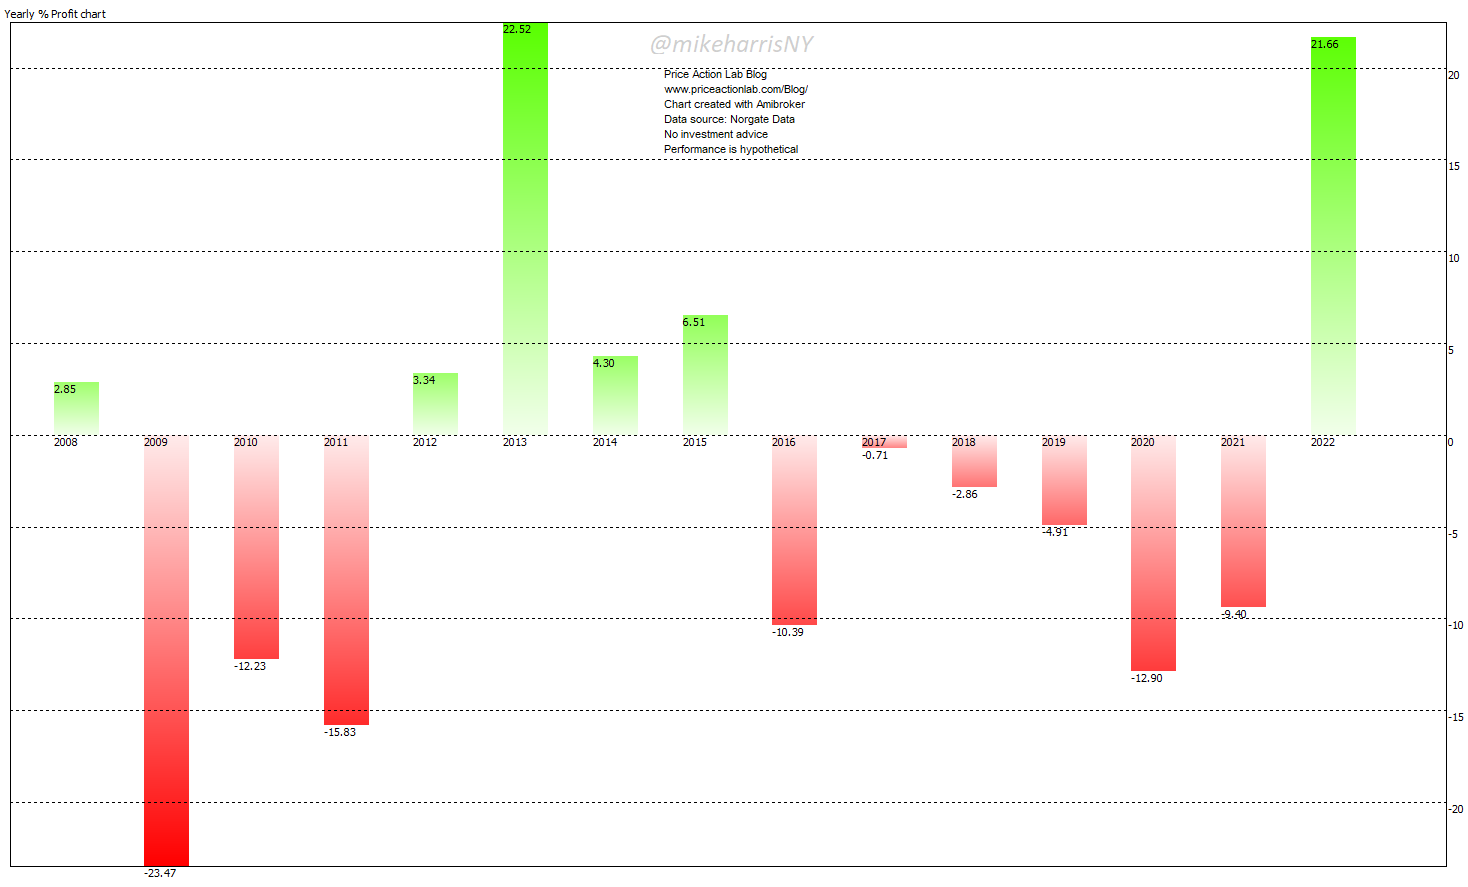
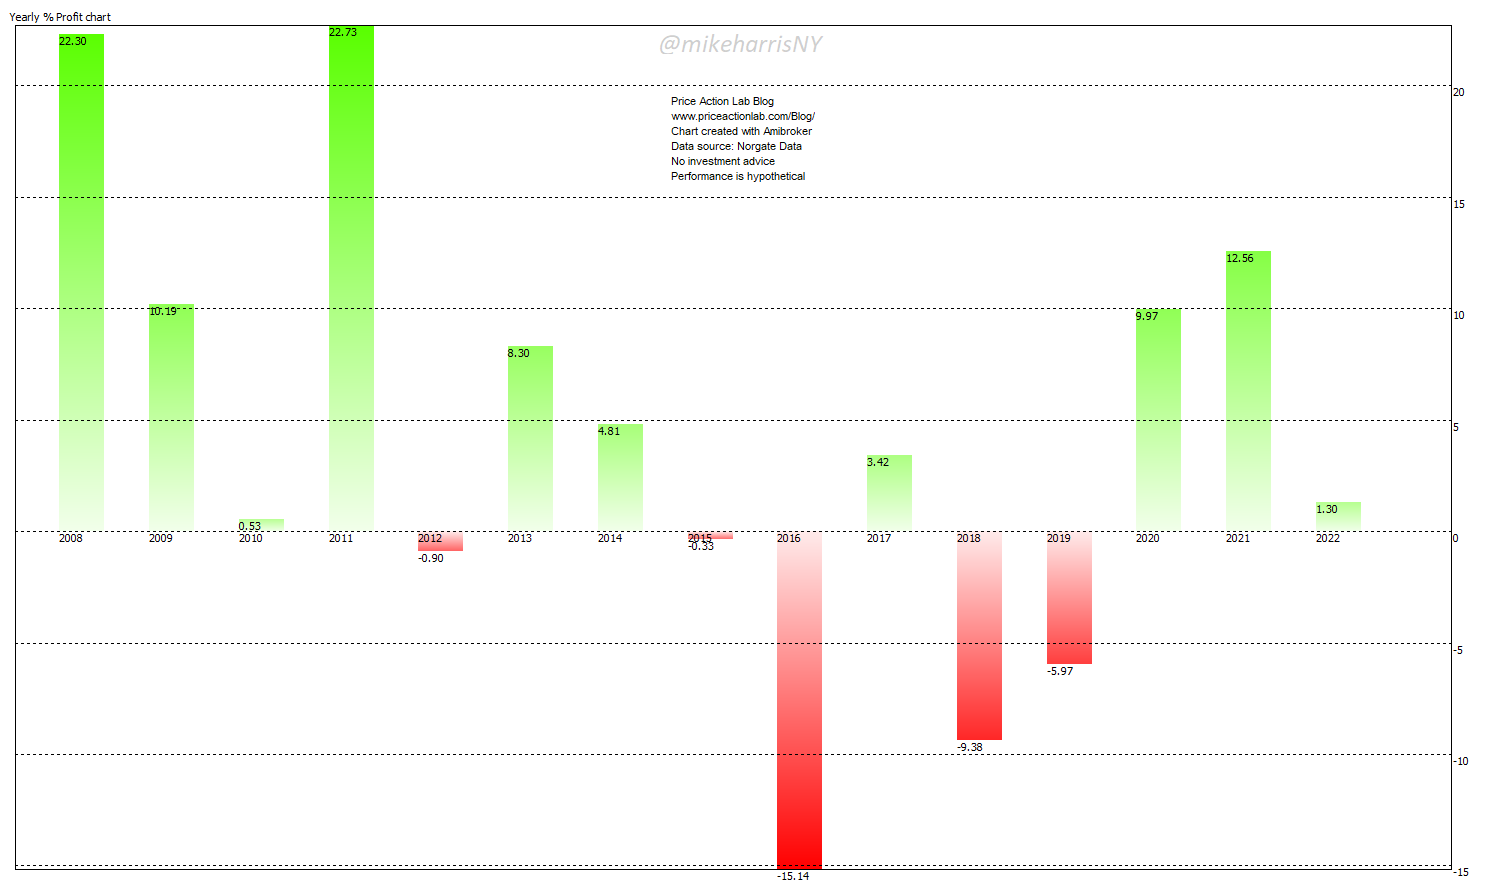
For this example, we used a 12-month lookback period. This year’s performance is nearly as good as in 2013, with a return of about 22%, but this asset rotation based on the 12-month rate-of-change has been highly unprofitable, with a CAGR of-3% and a maximum drawdown of about 53%. Is there any way to fix this by changing the lookback period?
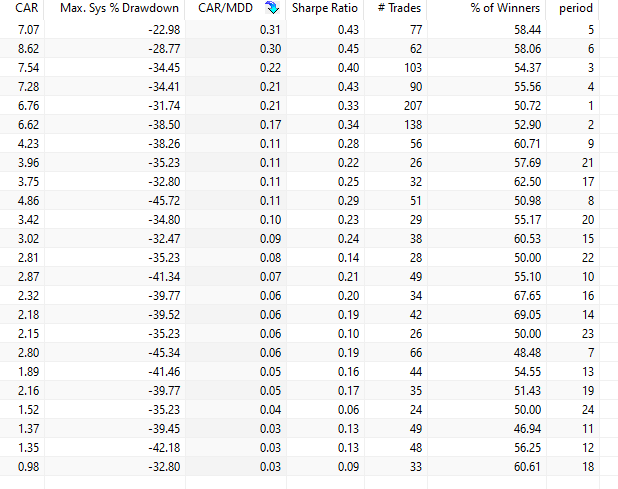
Before looking at the impact of the lookback period on results, we will look at the impact of the number of long and short positions allowed. Below are the results for 1 to 6 assets, long and short, sorted by highest MAR (CAGR/Max. DD).
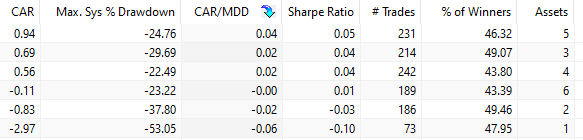
The results are disappointing. For 3 to 5 long and short positions, CAGR is marginally positive, but for 1, 2, and 6, it is negative. A 12-month period has been a bad choice historically, regardless of the outperformance this year.
For informational purposes only and while emphasizing that this is a dangerous practice, we vary the lookback period from 1 to 24, for one asset, long and short.
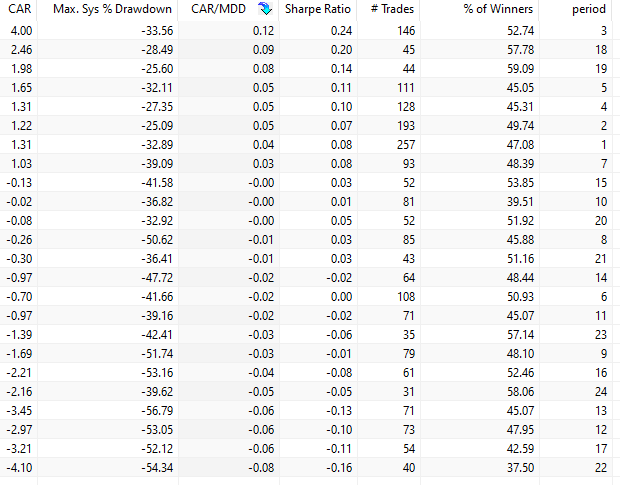
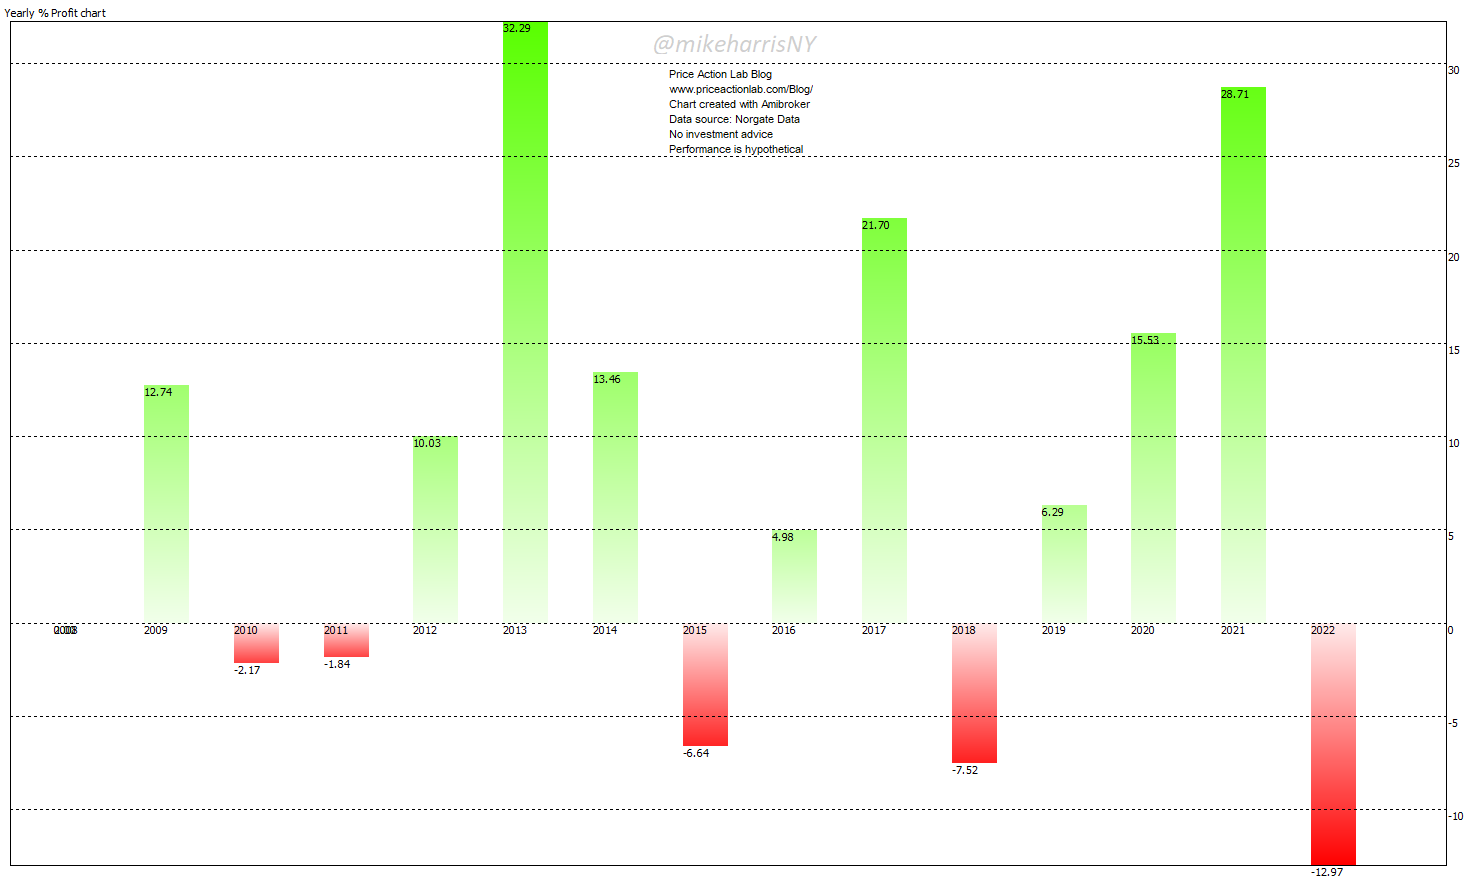
The best MAR ratio (CAGR/Max. DD) was realized for a lookback period of 3 months. Below is the chart of yearly returns.
Year-to-date profits evaporated, while 2020 losses reverted from -13% in the case of a 12-month lookback period to about 10% for 3 months. The CAGR is 4%, and the maximum drawdown is 34%. Interestingly, the maximum drawdown was realized in 2020.
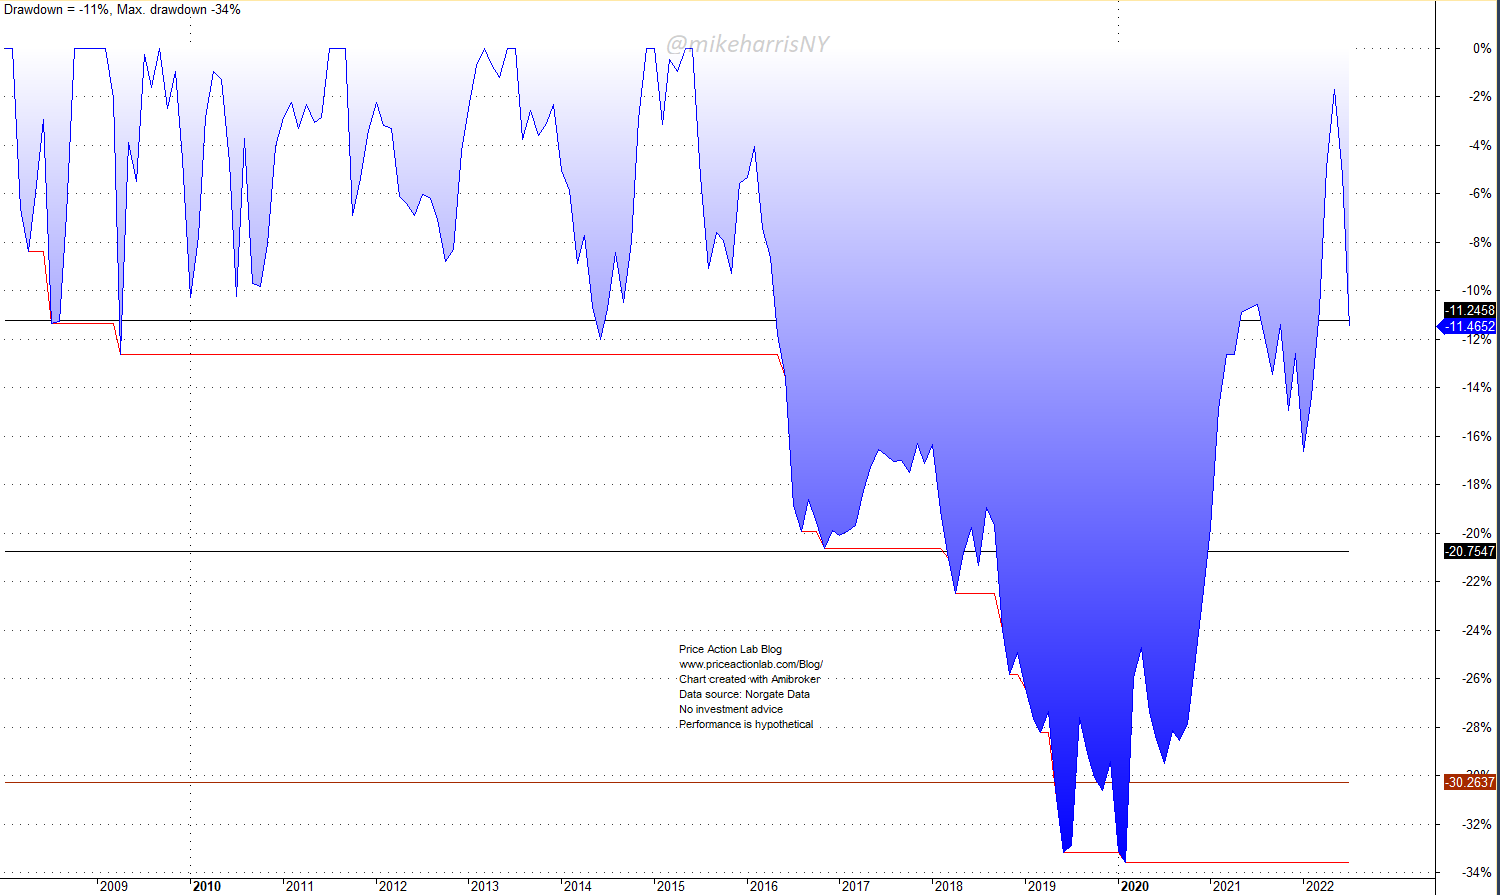
Therefore, what appears to be a spectacular reversal for 2020 came at the higher pain of a large drawdown.
Note that for most choices in the lookback period, this strategy has been unprofitable, and any gains for a small subset of values may be random. Long-short asset rotation as described above is a dangerous, high-risk strategy. “Go long X asset and short Y asset” may sound like it comes from a credible source, but in reality, those who make these calls are fooled by randomness. There is nothing in asset rotation but high risks. What about long-only?
2. Long-only rotation
Below is the performance table for lookback periods from 1 to 24.
As expected, all choices of lookback period are profitable, but the maximum MAR (CAGR/max. DD) is for a 5-month lookback period. The maximum CAGR is for a 6-month lookback period. Interestingly, for a 12-month lookback period, performance is next to worst at the bottom.
Below is the chart of yearly returns for the 5-month lookback period. Reminder: in this case, the top two ETFs are held long, with monthly rebalancing.
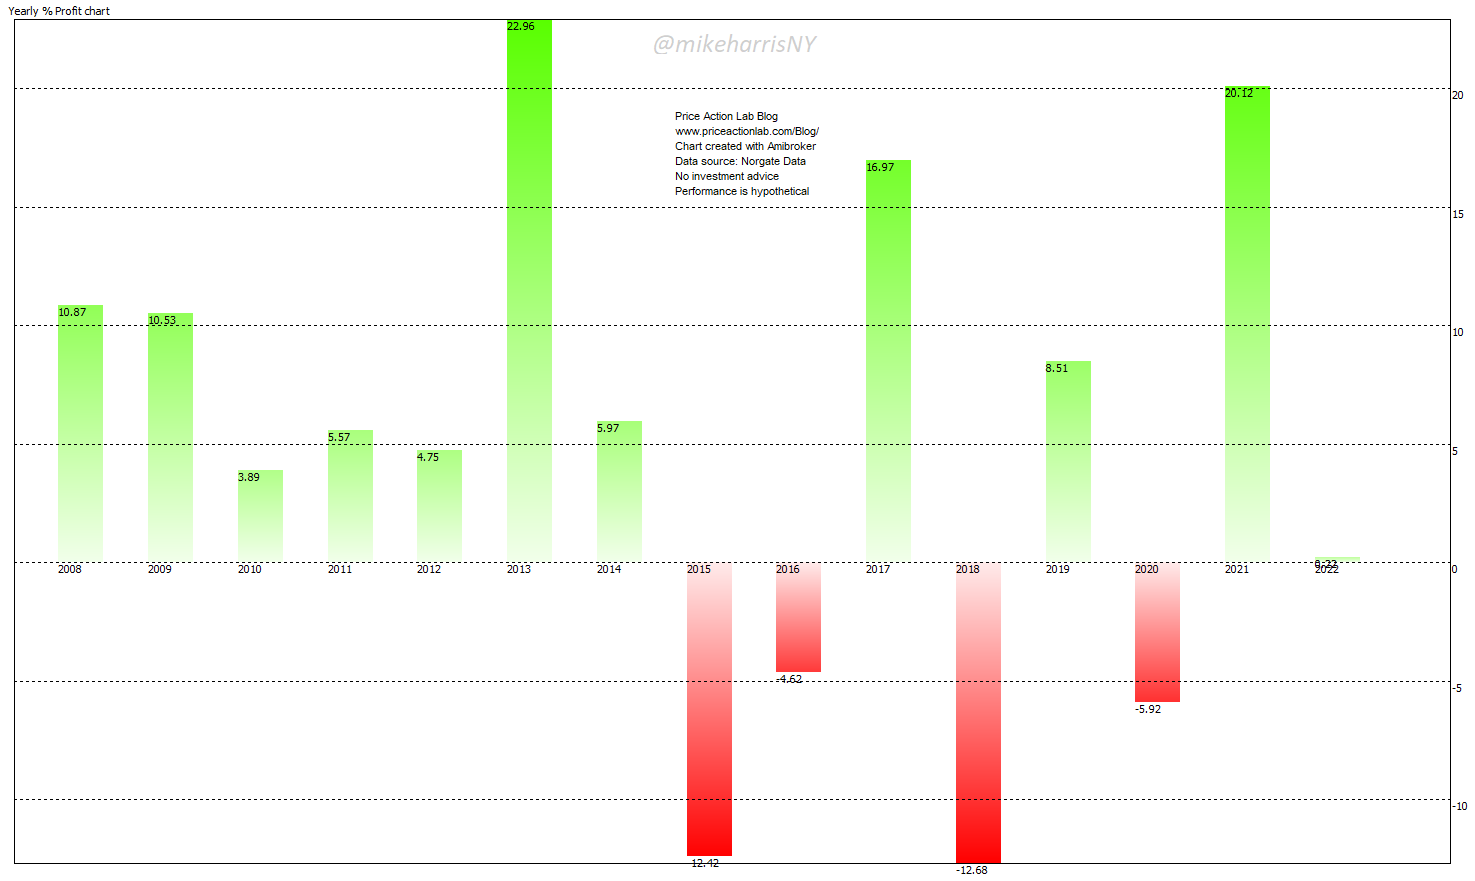
The CAGR is 7.1%, and the maximum drawdown is 23%. This is a huge improvement and sends a message: shorting is not easy and can hurt profits.
However, the performance of the long-only rotation is no better than that of a simple momentum strategy in SPY.
The CAGR is the same as that of long-only rotation with a 5-month lookback period at 7.1%, but the maximum drawdown is lower at 20%. Note that year-to-date the performance of simple momentum, as defined in this article, is negative, but this may change depending on price action.
3. Taking into account the volatility of assets
After a follower on Twitter mentioned taking volatility into account, I backtested several variations of rotation with a rank that takes that into account. Overall, performance is lower, although drawdown decreases. There is also the danger of over-fitting.
Summary
Narratives rarely translate into sound strategies in reality. “Go long asset X, and go short asset Y”, is more of a marketing pitch than a prudent approach to market trading and risk management. Especially in the case of asset rotation, performance appears to be sensitive to the lookback period, while the optimum value of this variable in the future is always unknown in advance. Traders and investors should scrutinize all calls made about the markets in the context of a systematic approach. In other words, the calls should be the output of a sound strategy rather than a promise based on the skills or abilities of an analyst. When we backtest strategies, many myths collapse, and the market is full of myths.
Premium Content 10% off for blog readers and Twitter followers with coupon NOW10
Disclaimer: No part of the analysis in this blog constitutes a trade recommendation. The past performance of any trading system or methodology is not necessarily indicative of future results. Read the full disclaimer here.
Charting and backtesting program: Amibroker. Data provider: Norgate Data


