


Utilities fell sharply last week due to Hurricane Ian. The Dow Jones Utility Index plunged 9.2% for the week, which was a five-standard deviation move based on the historical sample since 1943. Utilities have been more volatile than the market this year.
The first large drop this year occurred in the week ending June 17, 2022, and it was a -9.5%. The second large drop this year occurred in the week ending September 30, 2022, and it was a -9.2%. Both of those drops were five-standard-deviation outliers to the downside.

Since 1943, the mean of weekly returns is 0.11% and the standard deviation is about 2%. Weekly drops of move that 9% are negative five standard-deviations moves based on the available sample.
The S&P 500 index is also plotted along with the histogram of weekly returns. It may be seen that large weekly drops of more than 9% in the utility index have occurred during bear markets and large corrections. Below is a table.
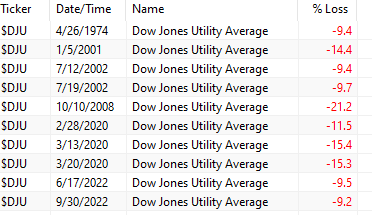
There have been 10 drops in the Dow Jones Utility Index of more than 9%. The last five have occurred during the 2020 crash and 2022 bear market. One occurred in October 2008 before the final top of March 2009, two in July 2002 before the final bottom in October of the same year, and one in April 1974 before the final bottom in October of the same year.
Utilities are sensitive to rate rises and natural catastrophes. During this year, utilities gained as yields rose but then there was a corrective move.

Utilities (XLU) were positive from mid-March to mid-April, then from mid-May to mid-June, and finally from mid-July to last week. The top year-to-date performance was 10.7% and the ETF closed last week down 6.5%.
If fact, the annualized 21-day standard deviation of XLU ETF is 26.5%, and that is higher than that of SPY ETF, which is at 23.3%.
However, due to the high sensitivity to interest rates, utilities have had slightly higher volatility as compared to stocks, historically.
For Limited-Time Only Premium Content Is 10% off for blog readers with the coupon NOW10
Disclaimer: No part of the analysis in this blog constitutes a trade recommendation. The past performance of any trading system or methodology is not necessarily indicative of future results. Read the full disclaimer here.
Charting and backtesting program: Amibroker. Data provider: Norgate Data


