


A strategy trading only one asset in the monthly timeframe has outperformed the SG CTA Index in the last 24 years. It is better than replication.
Update: December 29, 2023
There are four capital markets at the highest level, and fundamentals determine their price movement in the long term. One of those assets is inextricably linked to the price action in at least two of those capital markets. The strategy trades one asset long-only and uses another asset to generate the entry and exit signals.
Below is the equity chart, drawdown profile, yearly and daily return, and comparison to SG CTA Index performance.
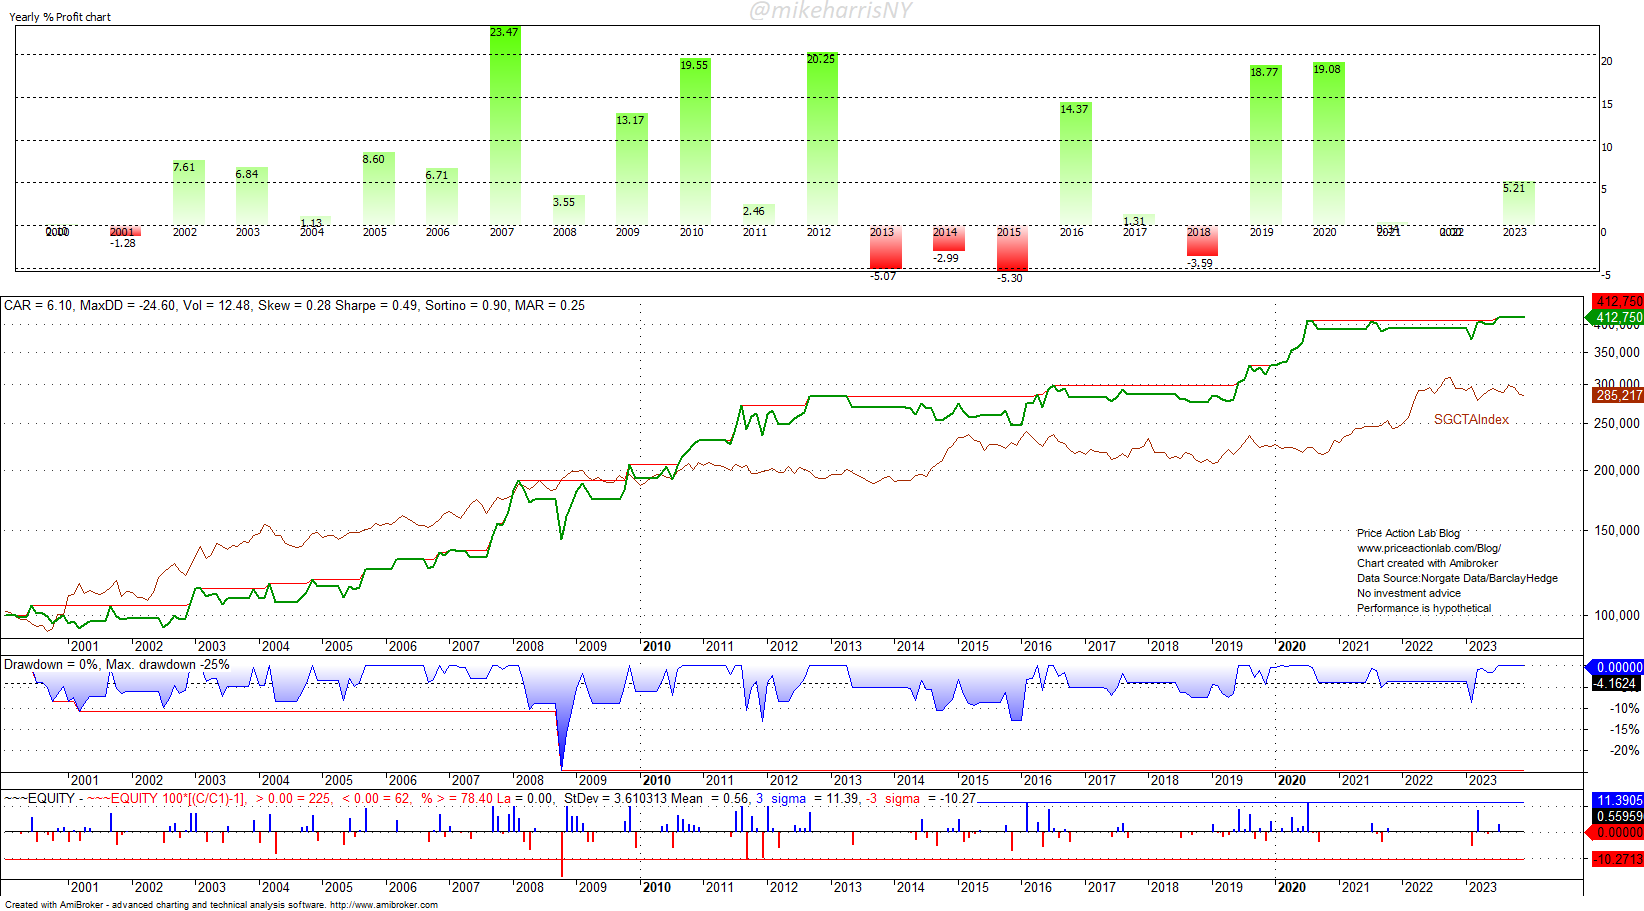
The green line is the equity line of the strategy. The red line is the performance of the SG CTA Index. The backtest starts on January 3, 2000, and ends on December 29, 2023. The strategy underperformed the SG CTA index until 2010, but has since outperformed.
| SG CTA Index | Strategy | |
| Annualized Return | 4.5% | 6.1% |
| Maximum Drawdown | -14.3% | -24.6% |
| Volatility | 8.7% | 12.5% |
| Sharpe Ratio | 0.51 | 0.49 |
| Number of Trades | – | 35 |
| Win Rate | – | 60% |
The simple strategy is not data-mined but based on a sound hypothesis about the price action of the asset used. The timeframe is monthly and the strategy takes only long positions. Positions can also be established at the open of the following month after the signal, with no change in performance.
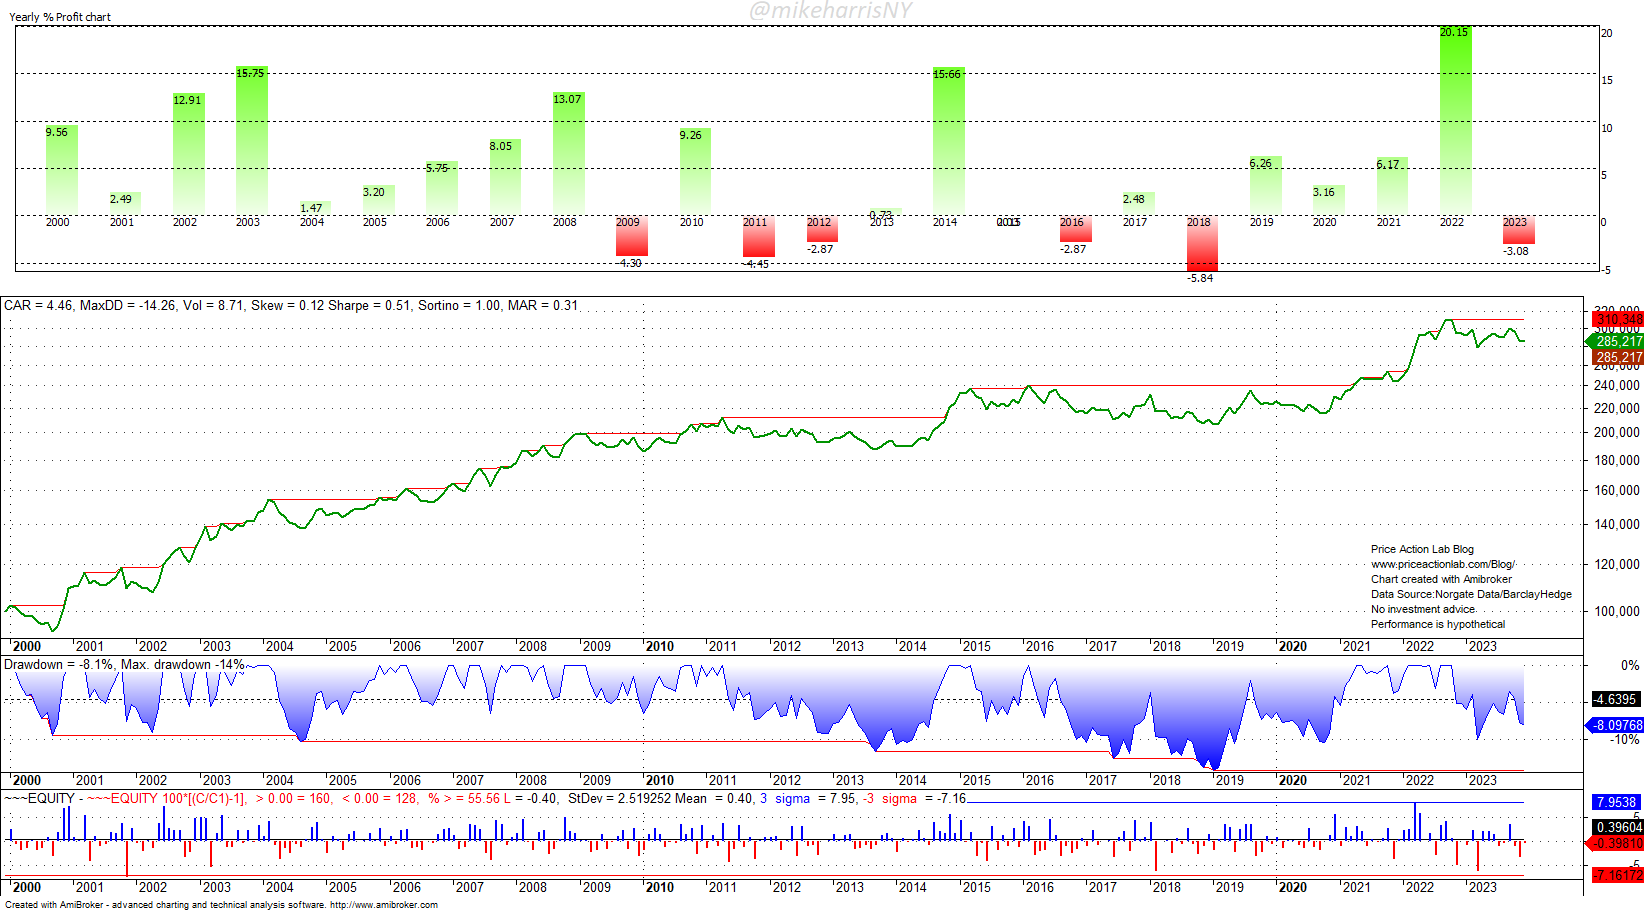
For reference, below is the performance of the SG CTA index from 2000 to 2023.
Trading strategy rules and Robustness Analysis
The rules of this simple strategy are available with a Trend-Following subscription.
|
This post is for paid subscribers
Already a subscriber? Sign in |
Disclaimer: No part of the analysis in this blog constitutes a trade recommendation. The past performance of any trading system or methodology is not necessarily indicative of future results. Read the full disclaimer here.
Charting and backtesting program: Amibroker. Data provider: Norgate Data
If you found this article interesting, you may follow this blog via RSS or Email, or on Twitter


