


Occasionally, rare outliers are delivered by the markets. Should the long-term performance of a strategy depend on catching those rare outliers? Our answer is “No”.
Before we get a bit mathematical and present simulations, let us use some common sense.
It is a fact that rare outliers form in the markets. One example is bitcoin, which has offered a few of these since its inception. Another more recent example is the rally in lumber prices during the 2020 pandemic.
There is a problem, however: there are no guarantees a trend-following strategy will be able to make the most out of those rare outliers and the reason is trend volatility. Rare outliers are only known in hindsight and any strategy that catches one in backtests may fail to catch the next real one due to a stop or reversal signal.
Instead of relying on rare outliers, a more prudent trend-following strategy should attempt to catch as many of those “regular” trends. Winning the lottery offers a wealth boost, but it may not happen.
Additive vs. multiplicative processes
I have offered some details about the fundamental differences between additive and multiplicative processes in an article on Medium.
In a nutshell, as related to trend-following and trading in general, an additive process is one where every trade has a constant dollar risk, and realized gains are not used to increase position exposure. On the other hand, a multiplicative process is one where realized gains are used to increase position exposure. As I have shown in the Medium article mentioned above, every additive process has a hidden multiplicative nature, and a compound annual growth rate (CAGR) can be computed for both. The CAGR is not only a property of the multiplicative process.
Rare Outliers and Exponential Growth
Rare outliers can yield exponential growth. An example is bitcoin from 2016 to 2017.
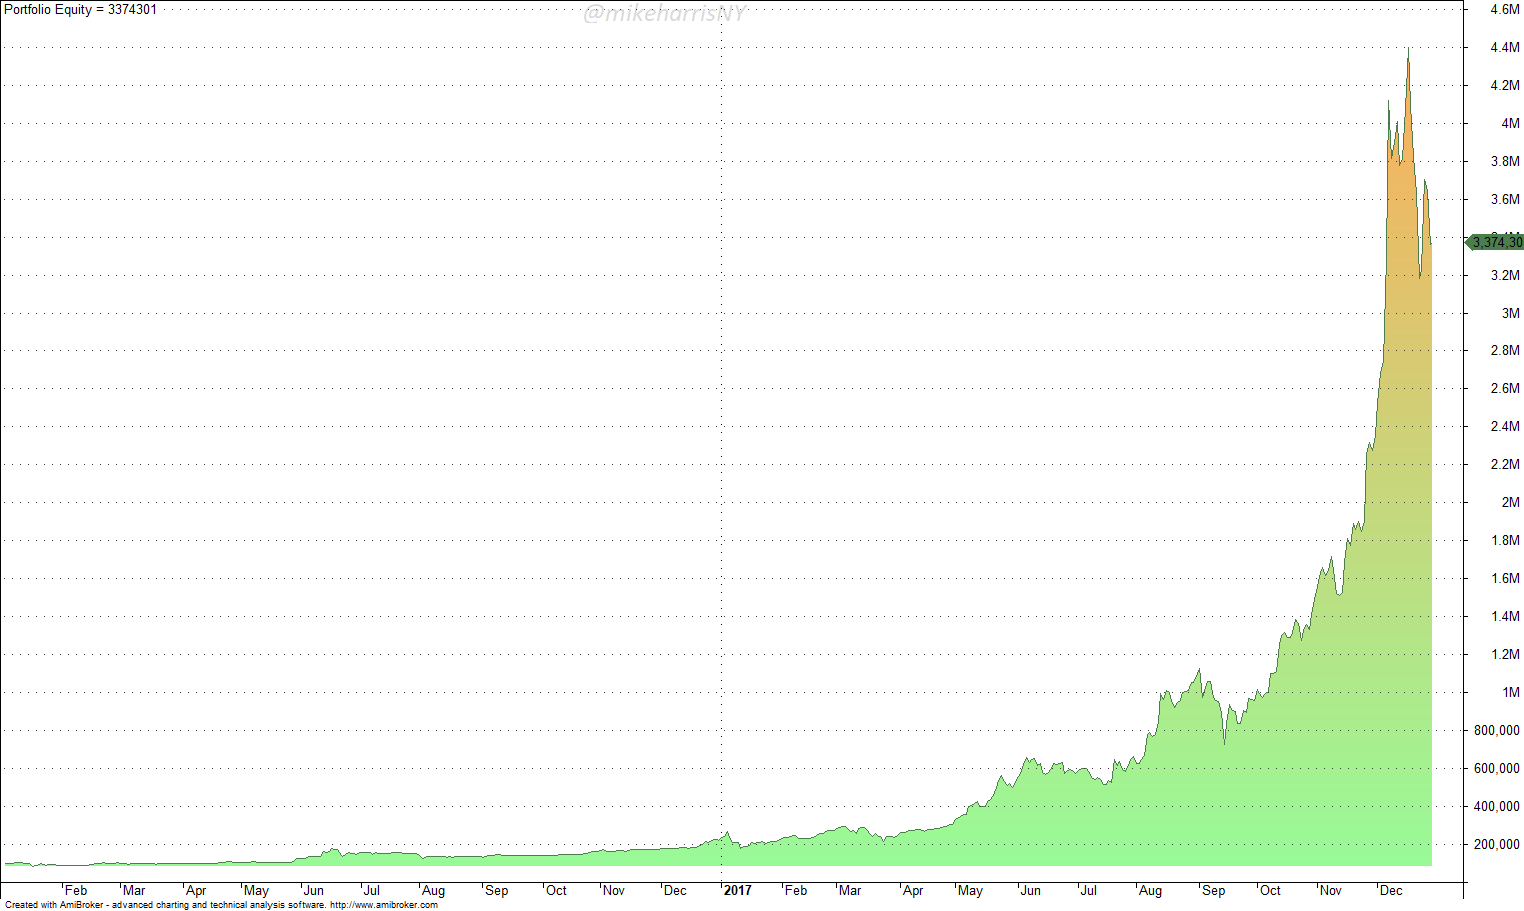
An investment of $100,000 in bitcoin on January 1, 2016, would have grown to more than $3,250,000 by December 31, 2017; hindsight is wonderful!
The CAGR in the two-year period is 484%! The type of exponential outlier can cause excitement to some aspiring trend followers, usually the ones with not much experience with the difficulties of catching exponential trends, both practical and psychological.
Keeping the realities of trend-following aside, and the fact that it is the hardest style of trading, obviously catching outliers that can turn linear equity growth into exponential, even for a short period, is appealing. In the analysis below, we will focus on constant risk trend-following, i.e., all trades have a constant dollar risk value.
Let us assume that during the same period from 2016 to 1017, a trend-follower was also trading Dow 30 stocks and 22 of them were in an uptrend. The trend-follower had divided the risk capital by 22 and allocated it to the 22 stocks. Below is the resulting equity curve for holding those 22 Dow 30 stocks from 01/2016 to 12/2017.
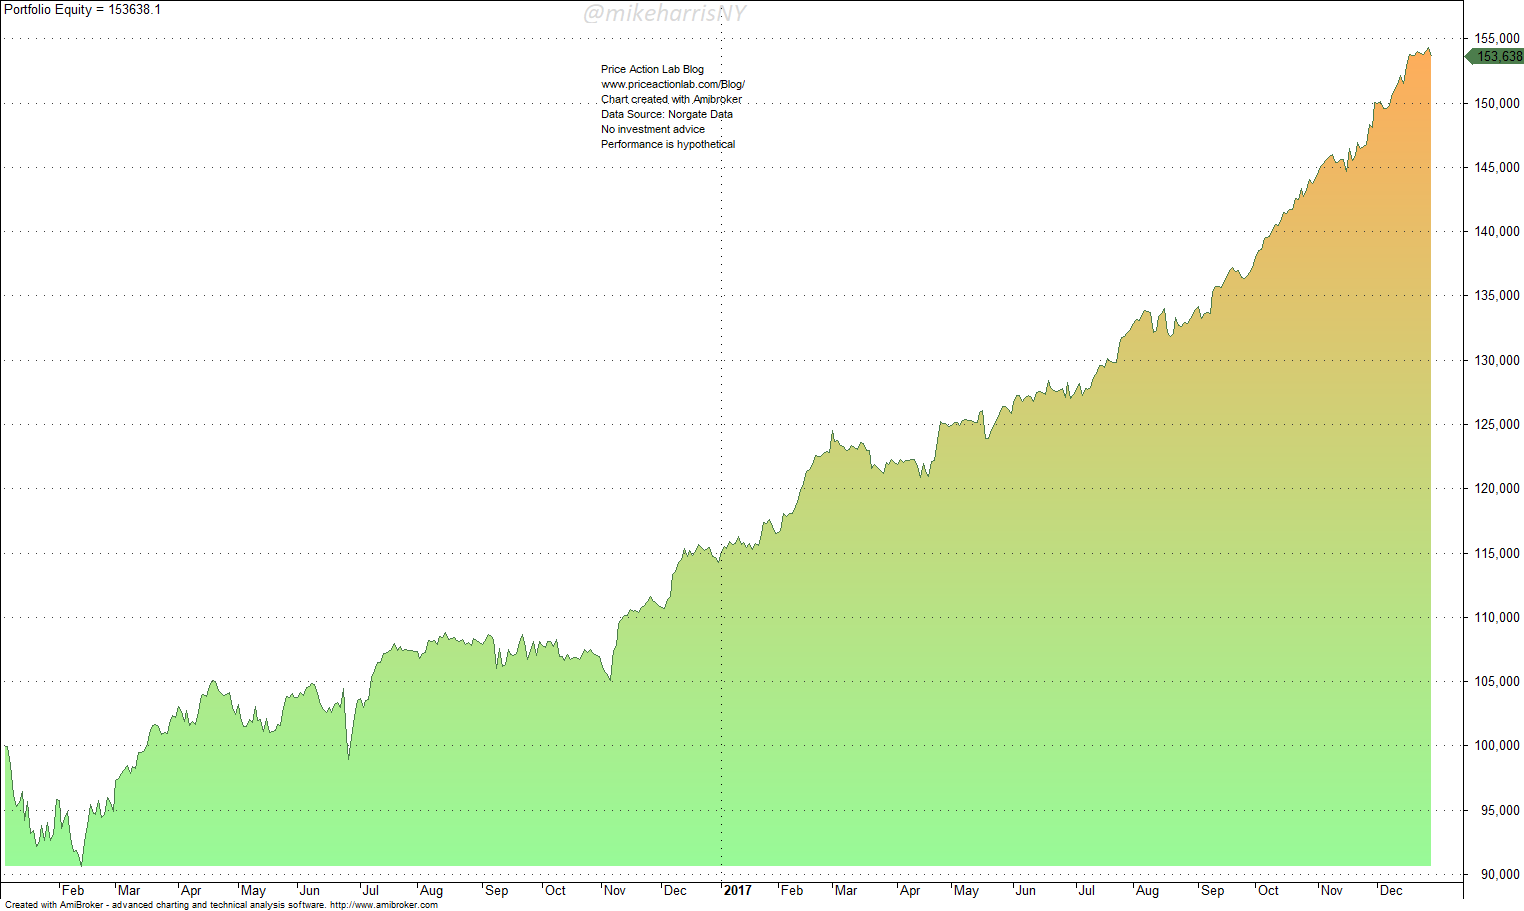
The equity curve is linear due to an additive process of returns and the absence of an exponential outlier. The CAGR is 24%. Next, this is what happens after we add bitcoin to the mix of assets, and size trades by dividing the initial capital by 23.

The CAGR increased from 24% to 70%, and the equity curve turned exponential.
“This is what I want!” The trend-follower said. “I will go after large outliers.”
Below is what happened after the bitcoin trade was closed but the strategy kept the Dow 30 positions open to December 2022.

As expected, after an exponential rise for two years, the equity curve turned again linear. In the long term, the impact on growth from rare outliers is small. We can simulate that by making some assumptions without loss of generality.
We assume a strategy makes 5 times what it losses on each trade on average, with a 50% win rate, 1% constant dollar risk per trade, and 10 markets. There are random rare outliers that deliver 100 times the amount risked on some trades. Below is one path for this simulation.
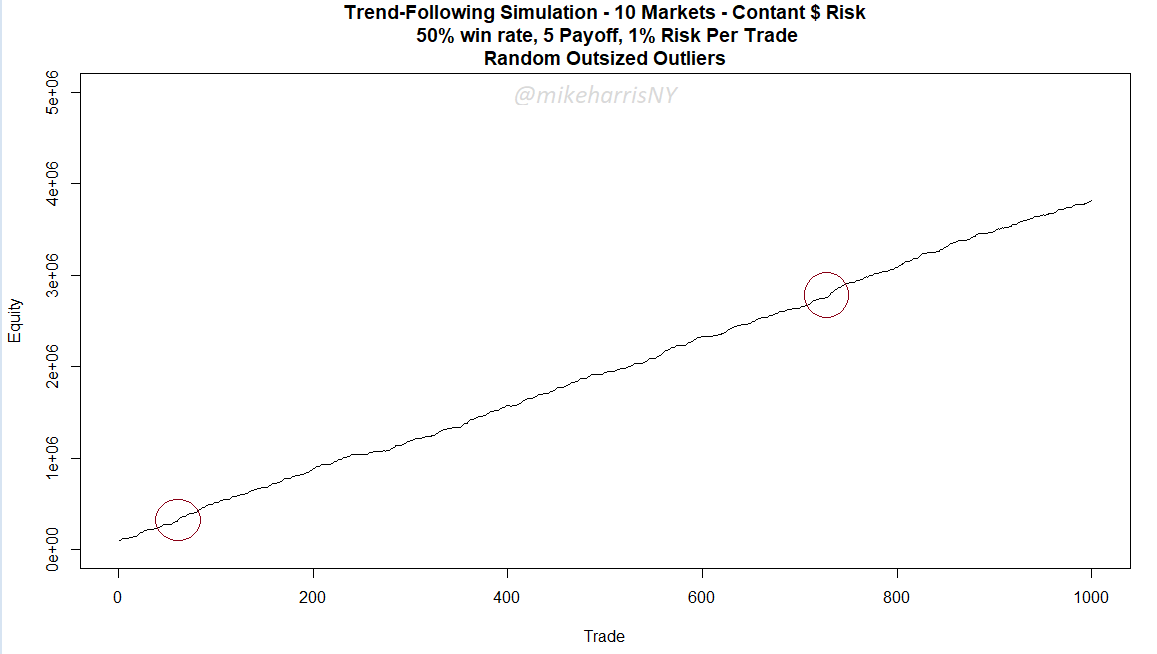
The equity curve is linear, and the red circles show occasions of outsized outliers. The outliers have the effect of increasing the slope of the line but they cannot convert a long-term linear equity curve to an exponential one. For that, one must compound returns by increasing position size.
With these examples, we have demonstrated the potential impact of rare outliers on trend-following and claimed it has a minimal impact in the long term. Instead of focusing on or hoping to catch rare outliers, trend followers should concentrate on improving the process of catching those more frequent, “normal” trends. Those are the trends that deliver the bulk of the performance. The rare outliers are lottery tickets with a small or even negative expectation in the long term. They are good when and if they happen, but one should not rely on them.
15% off all premium content with Discount Code PAL15
By subscribing you have immediate access to hundreds of articles. Premium Insights subscribers have immediate access to more than a hundred articles and All in One subscribers have access to all premium articles, books, premium insights, and market signals content.
Free Book
Subscribe for free notifications of new posts and updates from the Price Action Lab Blog and receive a PDF of the book “Profitability and Systematic Trading” (Wiley, 2008) free of charge.
Disclaimer: No part of the analysis in this blog constitutes a trade recommendation. The past performance of any trading system or methodology is not necessarily indicative of future results. Read the full disclaimer here.
Charting and backtesting program: Amibroker. Data provider: Norgate Data
If you found this article interesting, you may follow this blog via RSS, Email, or Twitter.


