


Trend-following CTAs delivered exceptional performance last year due to rare economic conditions that created favorable conditions for their strategies but in the last 22 years have failed to outperform the simplest momentum strategy.
After a “lost decade” from 2009 to 2018, trend-following CTAs recovered, and last year delivered the best performance since 2000.
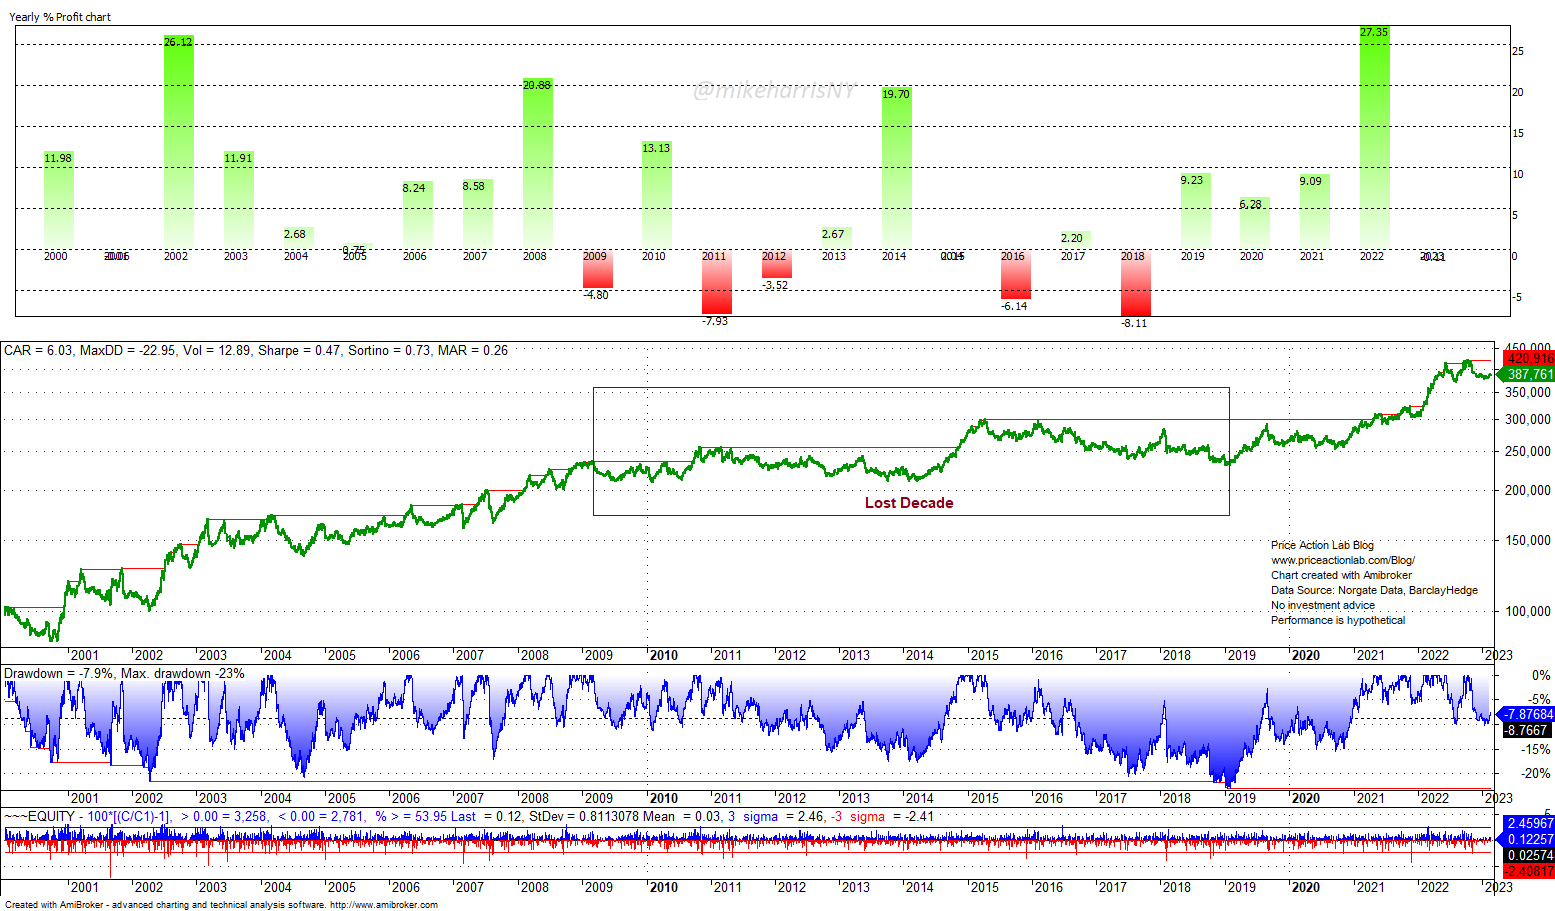
SG Trend Index Performance 01/03/2000 – 02/24/2023
The SG Trend Index (Société Générale) had a 0.4% annualized return in the lost decade, at 21.8% maximum drawdown, or a MAR of 0.02.
From 01/02/2019 to 02/24/2023, trend-following CTAs on the average (SG Trend Index) have a 61% total return, and an annualized return of 12.2%, at a 13% maximum drawdown.
However, in the same period starting in 2019, the SPY ETF has a 70% total return, a 13.6% annualized return, but a 33.7% maximum drawdown.
Therefore, in the last four years and 2 months, and despite the stellar performance in 2022, trend-following CTAs have delivered better risk-adjusted returns or a Sharpe of 1.1 for the SG Trend Index versus 0.61 for the SPY ETF.
Investors cannot live or retire on risk-adjusted returns, however, and it is only the total return that matters at the end of the day.
“We provided convexity”, trend-following CTAs will argue.
You cannot go to a store and spend convexity. Somewhere, a line must be drawdown between reality and narratives.
Even worse, trend-following CTAs have failed to outperform the most popular and simplest momentum strategy of all (1M12): buy the next month’s open when the price crosses above the 12-month moving average and sell the next month’s close when it crosses below it.
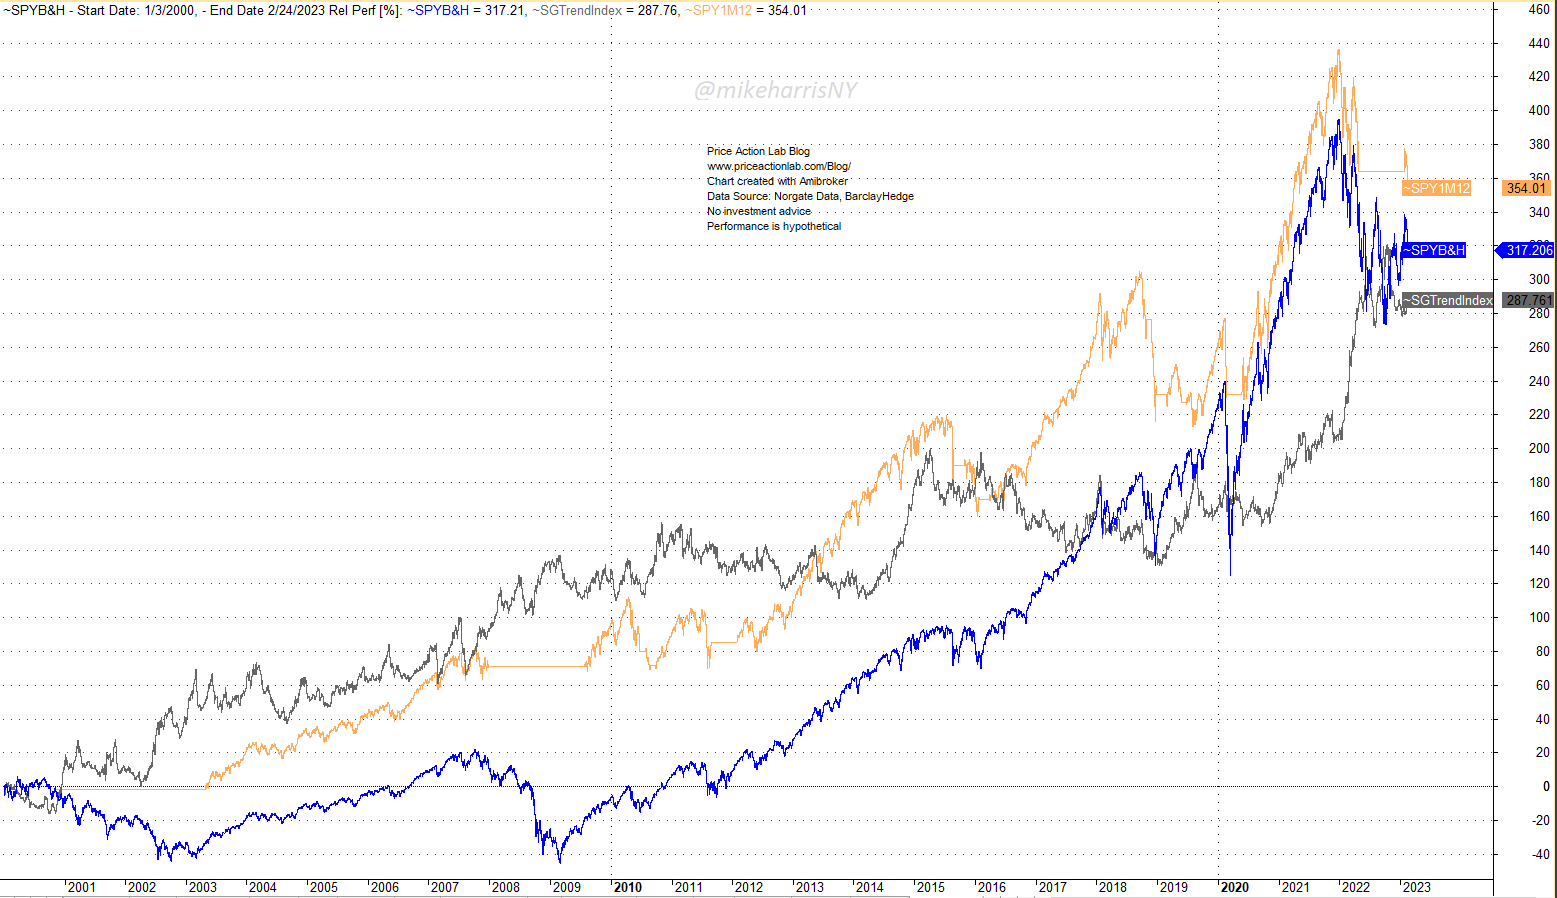
The chart shows the relative performance of the SPY ETF (blue), SG Trend Index (gray), and the simple momentum 1M12 strategy.
The 1M12 strategy has made 43% more than the SPY ETF buy and hold since 01/03/2000, and 66% more than the SG Trend Index.
Below is a table that summarizes key statistics for the three equity curves above.
| SG Trend Index | SPY B&H | 1M12 Momentum | |
| Annualized Return | 6.0% | 6.4% | 6.7% |
| Maximum Drawdown | -23.0% | -55.2% | -22.6% |
| Sharpe Ratio | 0.47 | 0.32 | 0.54 |
| Volatility | 12.9% | 19.8% | 12.4% |
| MAR | 0.26 | 0.12 | 0.29 |
The performance of the 1M12 momentum is better in all five metrics: annualized return, maximum drawdown, Sharpe, volatility, and MAR.
More importantly, this is a simple strategy anyone can trade in a brokerage account. Caveat emptor: In the case of a long sideways market in USA stocks, the 1M12 momentum strategy may accumulate large losses, but trend-following CTA profits will depend on whether there are trends in other markets and their performance will be uncertain.
Hype Vs. Reality
There is hype in the financial media about trend-following CTA’s performance, but the reality is the group has not been able to outperform a trivial momentum strategy in the last 22 years. All the fancy terminology has not resulted in performance materially better than buy and hold, except on a risk-adjusted basis.
Are investors paying too much for too little? It depends on objectives but it appears that there is more hype than real performance in the trend-following CTA space. There must be an improvement, and CTAs should maybe go back to their original goal of providing absolute returns. This is hard given the current realities of the market, and despite the outperformance in 2022 due to special market conditions, the CTA space will probably undergo some consolidation.
Allocators show signs of reluctance to add more funds to the space, and they may be justified, based on the above analysis. CTAs can do better, but they must move to the next level. Inertia is the enemy. “Adding more markets to catch outliers” instead of looking for better ways to deal with the new market regimes may or may not solve the problem. The ones who make a transition first will be the next long-term survivors. There are already specific and fascinating examples, but this will be the subject of another article.
15% off all premium content with Discount Code PAL15
By subscribing you have immediate access to hundreds of articles. Premium Insights subscribers have immediate access to more than a hundred articles and All in One subscribers have access to all premium articles, books, premium insights, and market signals content.
Free Book
Subscribe for free notifications of new posts and updates from the Price Action Lab Blog and receive a PDF of the book “Profitability and Systematic Trading” (Wiley, 2008) free of charge.
Disclaimer: No part of the analysis in this blog constitutes a trade recommendation. The past performance of any trading system or methodology is not necessarily indicative of future results. Read the full disclaimer here.
Charting and backtesting program: Amibroker. Data provider: Norgate Data
If you found this article interesting, you may follow this blog via RSS, Email, or Twitter.


