


The dual momentum strategy was described in papers and in a book published in 2013. Post-publication analysis shows a significant deterioration in performance. We attribute the performance deterioration to selection bias and regime changes.
This article is along the lines of a LinkedIn article published in February 2021 that demonstrated the significant deterioration in the performance of the dual momentum strategy. After reading the article (a link can be found at the end), I decided to test the strategy to verify the results.
I should note that there have been some variations on the original dual momentum strategy, but in this article, we deal with the original along the lines of the reference mentioned.
Edited on Monday, March 13, 2022: I have used the SPY ETF as a benchmark for comparison of performance, but the objective of this article was the performance deterioration of this tactical allocation after publication, not specifically a comparison to any other strategy or asset. However, I used the SPY ETF simply because that is what I use as a benchmark. Different benchmarks can be used, but this does not have any impact on the fact that the performance of dual momentum after publication has significantly dropped.
The dual momentum strategy rules
If the S&P 500 has outperformed T-Bills over the past 12 months, then invest in the asset that outperformed in the last 12 months: the S&P 500 or world ex-US equities.
If the S&P 500 has underperformed T-Bills over the past 12 months, invest in high-quality U.S. bonds.
I used SPY, VEU, and AGG ETFs for the backtests. My results were better than those generated in the quoted reference, but still, there was a significant deterioration of performance as compared to the pre-publication that reported a 17.4% annualized return, 12.6% volatility, and a 22.7% maximum drawdown.
Before proceeding, I would like to make a comment about backtests with high annualized returns above 10% to 12%. As I have argued many times in articles and social media posts, those usually arise from selection bias and over-fitting. When someone finds a strategy with 17% CAGR, the objective should be to try to determine what is wrong or what could go wrong rather than declaring a win, as I have explained in my book Fooled By Technical Analysis. High annualized returns may be due to favorable regimes and are unsustainable, as mean reversion is a very powerful force in the markets. Unfortunately, there is a tendency to attribute high returns to strategy robustness rather than favorable regimes. Usually, robustness tests are used in support of high outperformance without realizing that over-fitted strategies have high robustness by design.
In-sample performance from 2008 to 2014
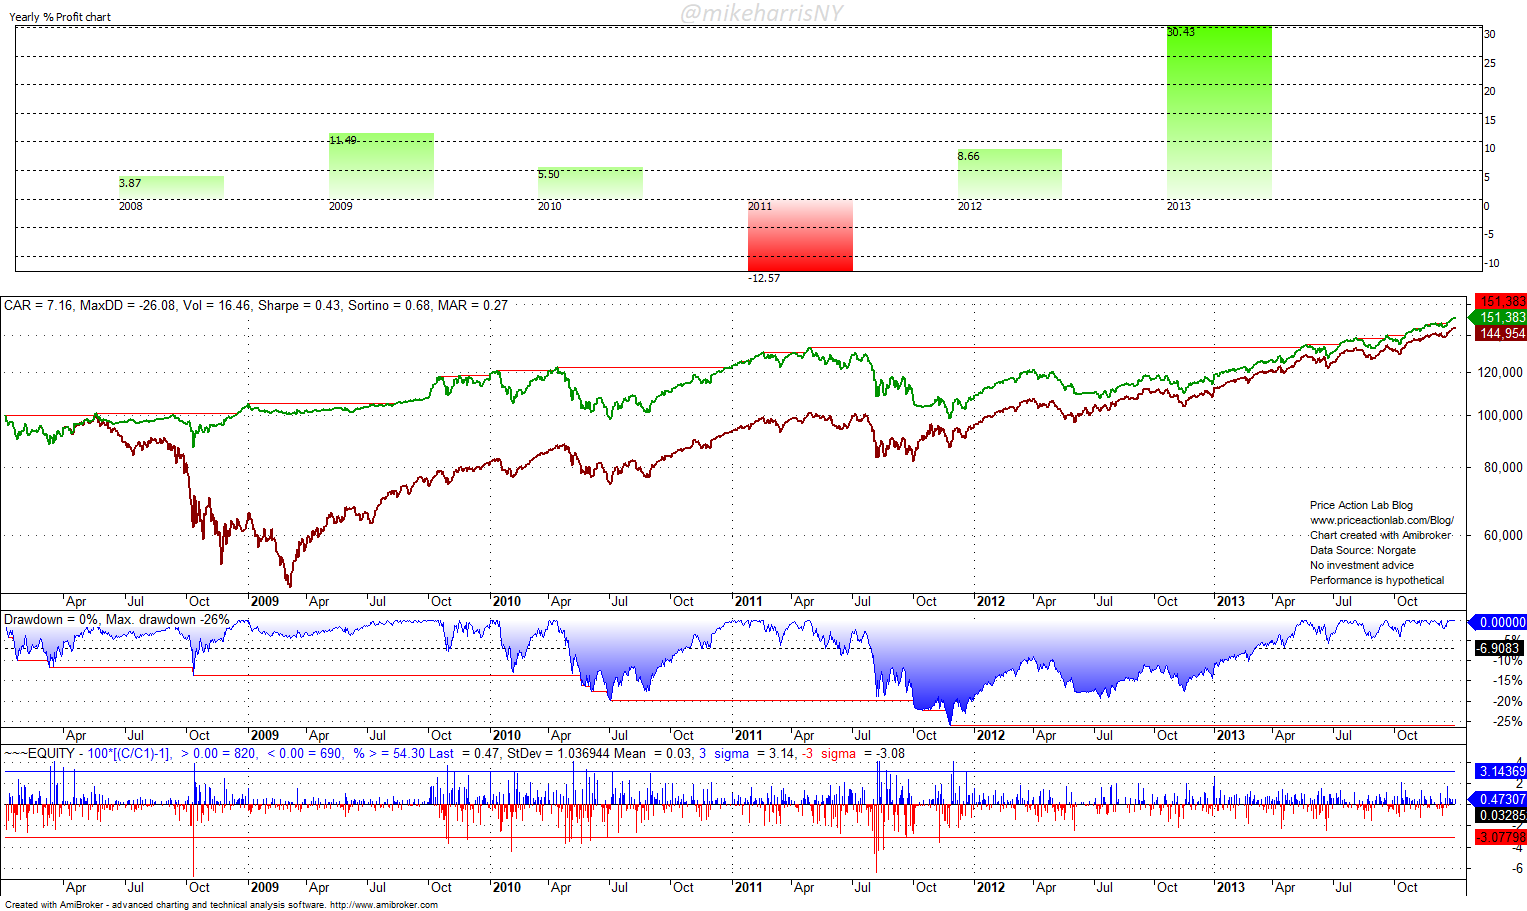
The in-sample test shows that dual momentum provided outperformance and better risk-adjusted returns when compared to SPY ETF buy and hold. The green line is the strategy equity, and the red line is the SPY ETF buy and hold equity.
| 01/2008 – 12/2013 | Dual Momentum | SPY ETF B&H |
| CAGR | 7.2% | 6.4% |
| Max. DD | -26.1% | -51.9% |
| Volatility | 16.5% | 24.4% |
| Sharpe | 0.43 | 0.26 |
Post-publication performance from 01/04/2014 to 03/09/2023
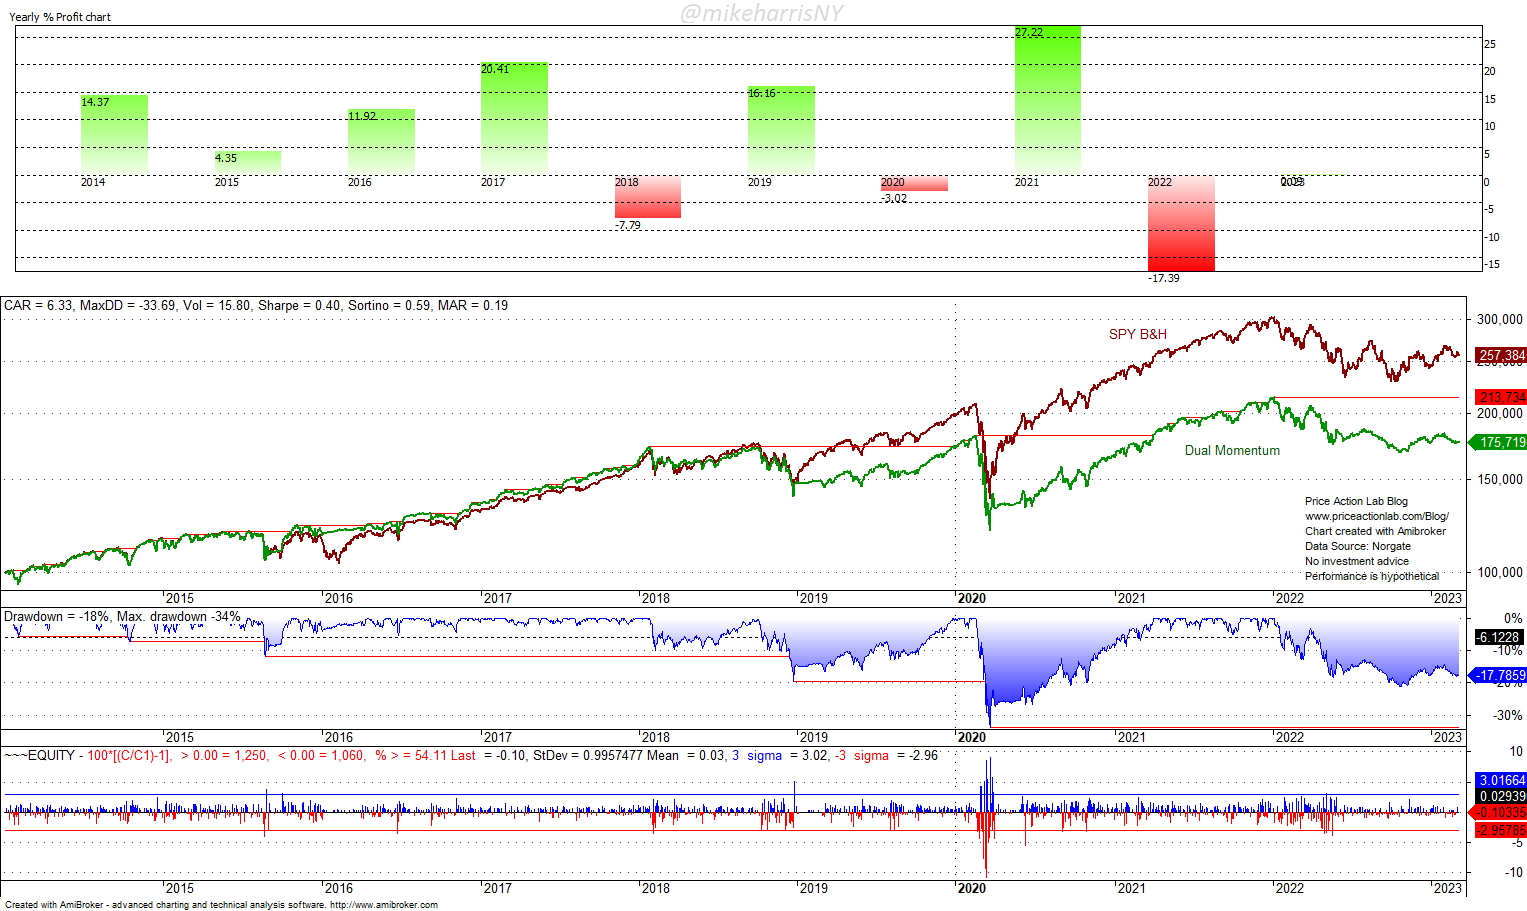
The dual momentum performance deteriorated after 2018, and the annualized return dropped to about a third of that during the per-publication period, while the maximum drawdown matched that of the SPY ETF.
| 01/02/2014 – 03/09/2023 | Dual Momentum | SPY ETF B&H |
| CAGR | 6.3% | 10.8% |
| Max. DD | -33.7% | -33.7% |
| Volatility | 15.8% | 17.9% |
| Sharpe | 0.40 | 0.61 |
The deterioration to “normal” tactical allocation performance was probably due to a regime change after 2012 and a gradual decrease in the anti-correlation of stocks and bonds until a switch to positive correlation after 2020. However, the specifics of the regime change are not as important as the fact that regime changes will occur and high pre-publication performance will undergo mean reversion.
Summary
Pre-publication and post-publication performances of dual momentum exhibit a wide divergence, and this is an indication that the strategy was the outcome of data mining and selection bias. All of the tactical allocations I have tested have exhibited this deterioration. Some practitioners do not realize the dangers of selection bias, but as it appears, this is also the case with some academics. In-sample high performance and especially annualized return levels above 12% should raise a flag about possible over-fitting.
Reference: Dual Momentum: Pre- and post-publication performance
15% off all premium content with Discount Code PAL15
This offer will expire Monday, March 13, 2023, at 5:00 pm (ET)
By subscribing you have immediate access to hundreds of articles. Premium Insights subscribers have immediate access to more than a hundred articles and All in One subscribers have access to all premium articles, books, premium insights, and market signals content.
Free Book
Subscribe for free notifications of new posts and updates from the Price Action Lab Blog and receive a PDF of the book “Profitability and Systematic Trading” (Wiley, 2008) free of charge.
Disclaimer: No part of the analysis in this blog constitutes a trade recommendation. The past performance of any trading system or methodology is not necessarily indicative of future results. Read the full disclaimer here.
Charting and backtesting program: Amibroker. Data provider: Norgate Data
If you found this article interesting, you may follow this blog via RSS, Email, or Twitter.


