


The belief that the US dollar and commodities are negatively correlated is probably due to recency bias.
The correlations between financial assets are probably random variables and regime-dependent. It is safe to assume that we do not have a large enough sample to determine if the correlations are non-random. The small samples can fool even quantitative analysis, and any inferences made are spurious.
Although in the last 20 years, commodities and the US dollar have usually moved in opposite directions, this may be due to recency bias. Historically, there have been periods with uptrends in both the US dollar and commodities, especially in the 1990s, as shown below in the daily timeframe.
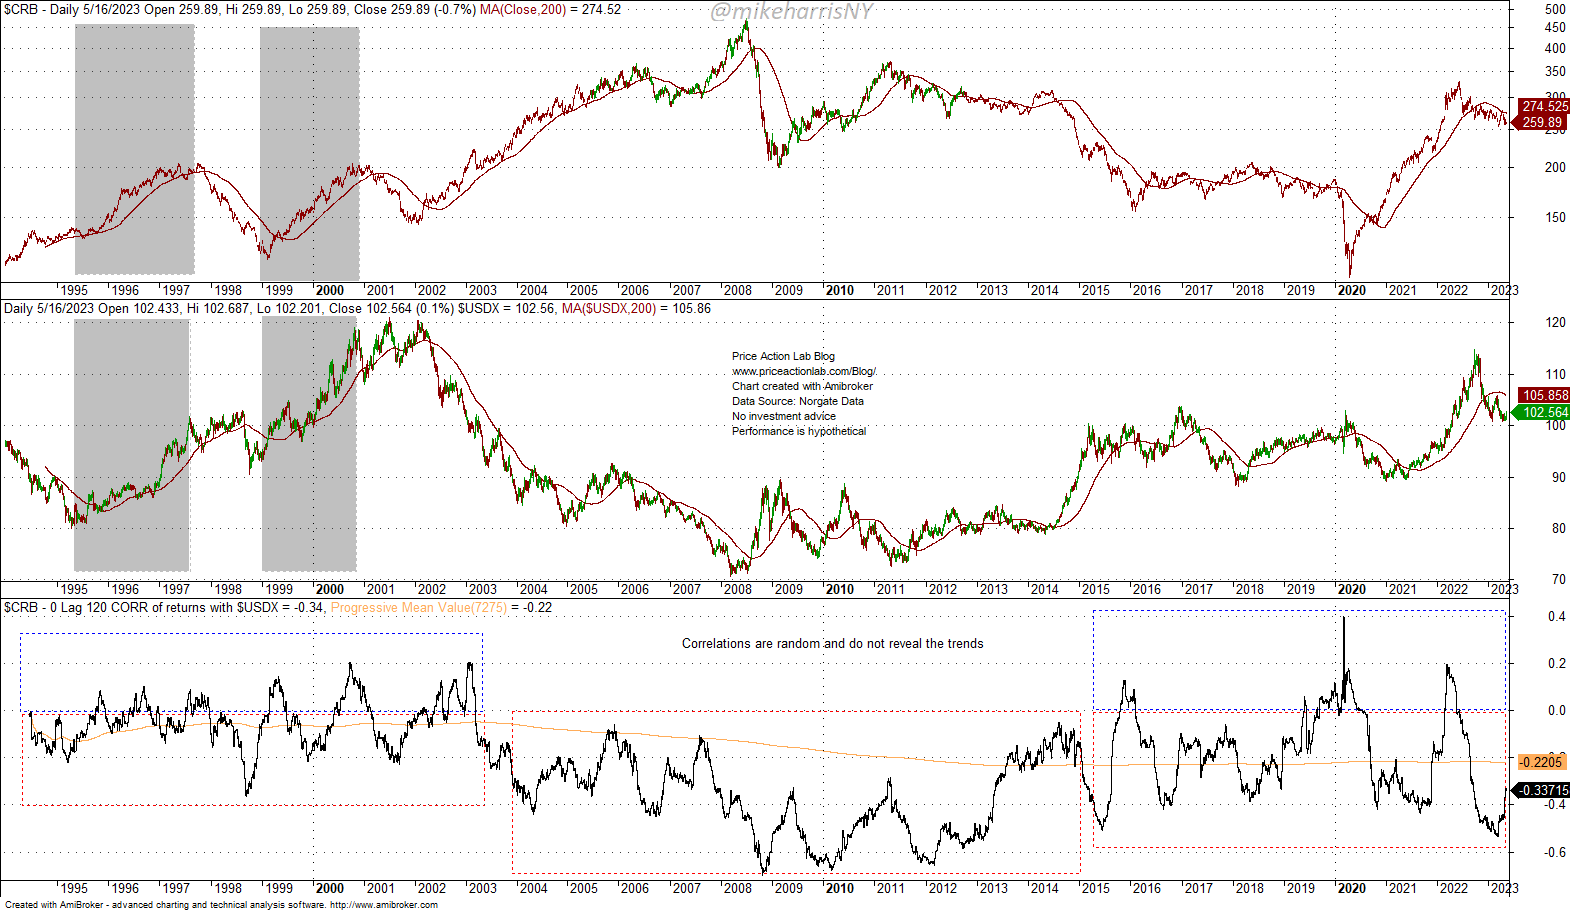
The top chart shows the CRB index; the next chart is the US dollar index; and the bottom chart shows the 0-lag, 120-day correlation of the daily returns.
It may be seen that in the 1990s, there were uptrends in both the CRB index and the US dollar. Then, in the 2000s, anticorrelation became prevalent and lasted until 2020. Afterward, the correlation became positive until the fourth quarter of last year.
The average 120-day correlation has been -0.22, but until 2007, it has stayed below -0.1 and closer to -0.05. During the GFC, the anticorrelation became more pronounced, but there were conflating variables, and there is no sound reason to claim there was a causal relationship or even an association between the US dollar and commodities.
If we look at the monthly chart and the 12-month correlation, we observe similar patterns.

In the 1990s, the correlation rose to +0.30, but it was volatile and mostly random. The same occurred in the 2010s, with a rise in the correlation to +0.35 in mid-2017. As the reader may suspect, there is plenty of randomness in the CRB-US dollar index correlation: there have been regimes when the correlation was positive, but the regimes with negative values dominate, and the average since 1994 is -0.35. However, the average is a random variable, as is the correlation.
Randomness can also fool quantitative analysis because of regime dependence and conflating variables. A sampling distribution of the monthly correlation after taking random samples with no replacement yields an extreme left-tail value for the average of -0.34.
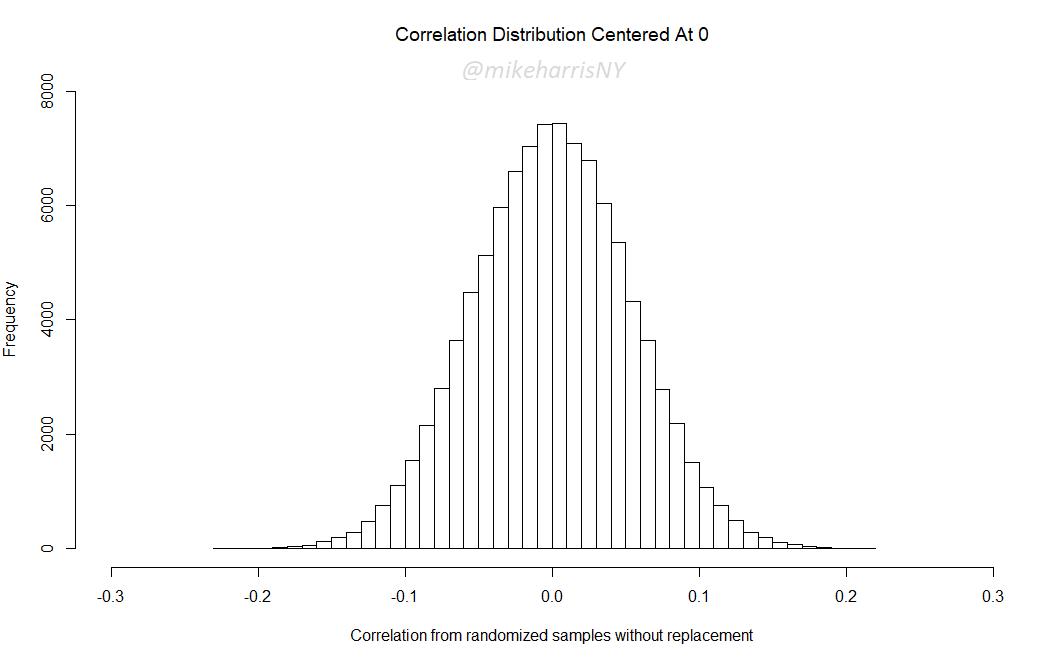
The left-tail minimum value is around -0.23, and the mean of -0.34 yields a p-value of 0. Therefore, the null hypothesis that the correlation is zero is rejected, but that is an artifact of randomness and regime dependence. The reality is that the p-value is random.
The big picture
The US dollar’s trends depend mostly on political decisions and less on market forces. The Plaza Accord of 1985 to depreciate the US dollar is a primary example of how political decisions can affect the movements of currencies. At the same time, commodity prices depend on a host of factors, including demand, supply, geopolitics, speculation, and others. Although most commodities are priced in US dollars and there is the perception that as the dollar value changes, it impacts prices, this is only one variable, albeit an important one. Recently, we saw how a supply shock can drive commodity prices higher even with a strong US dollar. Therefore, it is safe to assume that the true correlation between commodities and the US dollar is random.
Premium Content
Online Books
Premium Articles
Systematic Market Signals
Trading Strategies
Bonus offers
By subscribing, you have immediate access to hundreds of articles. Premium Articles subscribers have immediate access to more than two hundred articles, and All in One subscribers have access to all premium articles, books, premium insights, and market signals content. Contact us for any available discount coupons.
Free Book
Subscribe for free notifications of new posts and updates from the Price Action Lab Blog and receive a PDF of the book “Profitability and Systematic Trading” (Wiley, 2008) free of charge.
Disclaimer: No part of the analysis in this blog constitutes a trade recommendation. The past performance of any trading system or methodology is not necessarily indicative of future results. Read the full disclaimer here.


