

Price Action Lab (PAL) is a software program used by quantitative traders and hedge funds around the world for algo discovery and discretionary trading. This article lists the main features of PAL.
Price Action Lab has three main functions: search for price patterns, scan for price patterns and P-indicator calculations. The search function may be used by system traders for trading algo discovery and the other two functions may be used mainly by discretionary traders.
The Search Function
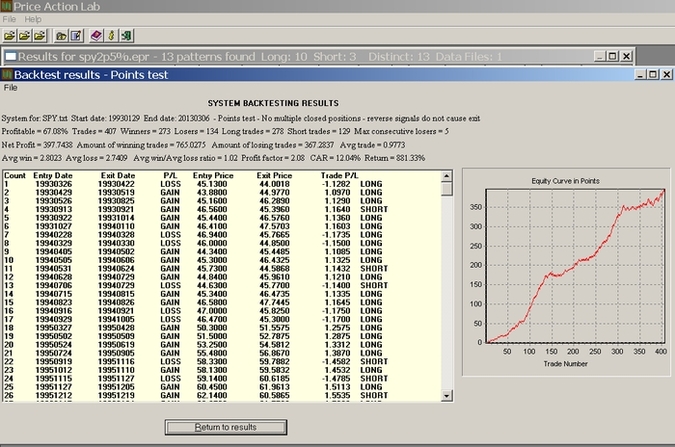
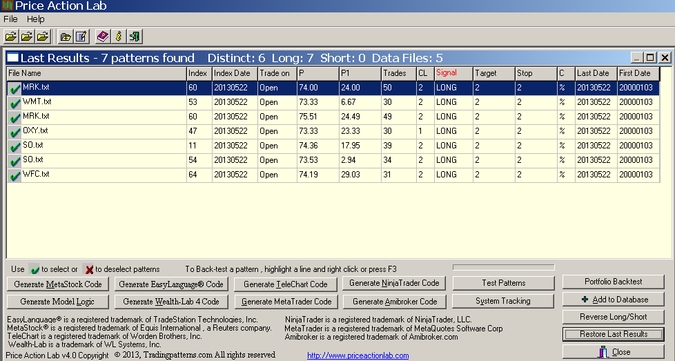
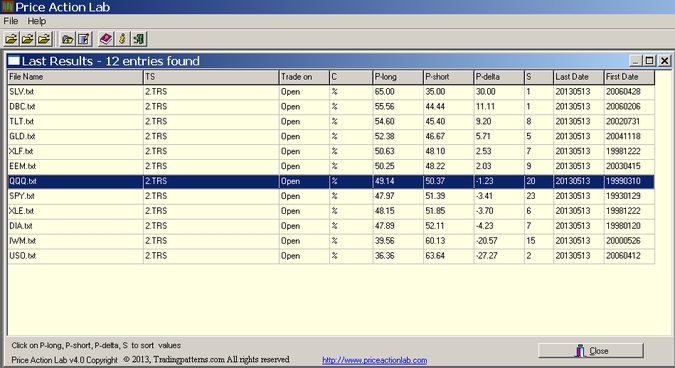
The search function can be used to discover price patterns in historical data of any timeframe (other than tick data) that fulfill user-defined performance statistics and risk/reward parameters. The patterns can be grouped in any way the user desires and in the case of daily data they can be added to the system tracking module of the program for monitoring daily signal generation. Alternatively, the program can generate code for a variety of trading platforms so that the price patterns can be implemented as indicators or trading systems. When the search function is used, PAL serves as a system that discovers trading systems automatically.
Here are some things that that can be done with the search function:
- Discover price patterns in historical data that fulfill user-defined performance statistics and risk/reward parameters. This is the primary use of the program by system trader.
- Discover price patterns in historical data that fulfill user-defined performance statistics and risk/reward parameters and are in addition profitable across several other securities.
- Identify in which markets there are short-term trading opportunities by noting the number of short-term patterns the program generates.
- Determine best profit target and stop-loss levels for particular markets by running a search with multiple parameters.
- Determine best timeframe to trade by running different searches in different timeframes.
- Use code generation to implement systems in various platforms and the raw code generation option to generate a file to be used as input for neural network or genetic programming engines.
- Perform portfolio backtests and exit sensitivity analysis to identify robust patterns.
- Identify mean-reverting strategies. Instead of finding robust patterns that maintain their profitability, one may identify high win rate patterns with a tendency for the win rate to revert to 50%. Click here for an example.
The Scan Function
The scan function can be used to determine whether there are any patterns formed as of the close of the most recent bar in daily data that fulfill the user-defined criteria set on the scan workspace.
Here is a partial list of what can be done with the scan function:
- Discover price patterns formed as of the close of a security that fulfill user-defined criteria and risk/reward parameters. Click here for an example.
- Get the number of long and number of short patterns to use as a sign of direction.
- Study the sensitivity of pattern formations to changes in exit values.
- Identify clusters of patterns to serve as an indication of a high probability setup.
- Determine the 1-bar win rate of patterns.
- Identify historical profitable pattern with next-close exit. Click here for an example.
- Scan multiple securities with multiple parameters. Click here for details.
- Use the scan output for managing risk of open positions. This is an example.
- Perform a portfolio backtest of the scan results to identify robust patterns. Click here for more details and examples.
The p-indicator function
The p-indicator is one of the most advanced technical analysis indicators ever developed. Its values can be used as an indication of the probability of the direction of short-term moves in daily data.
Here are some things that can be done with the p-indicator:
- Calculate the probability of the direction of daily short-term moves. An example can be found here.
- Determine the significance of the directional probability. Details can be found in this white paper.
- Use correlated symbols and check for agreement or disagreement in the results as an indication of higher/lower success rate.
- Determine the p-indicator values for multiple securities and for multiple parameters. Click here for an example. Click here for backtesting examples of p-indicator signals.
Finally, The best way to become familiar with a program is by actually working with it. There are many ways to use a trading program depending on user’s experience and objectives and this also applies in the case of Price Action Lab.