
Hybrid asset allocation (HAA) employs two strategies: asset cross-sectional momentum and strategic allocation. Both strategies use ETFs to generate signals.
The asset cross-sectional momentum strategy (CSMOM) and the strategic allocation strategy (MOMMF) generate signals in the monthly timeframe. The MOMMF incorporates both tactical and passive elements and undergoes annual rebalancing.
The current allocation is detailed below. Unlocking the protected content requires a subscription to Monthly Signals, Market Signals, or All-in-One. After each month’s last trading day, you can check for updates here. One subscription allows access to monthly updates for both HAA and DYNMOM. Follow @priceactionlab on X for updates and announcements.
Last update: June 28, 2024, after the close of the market. New equity highs for 2024.
|
This post is for paid subscribers
Already a subscriber? Sign in |
Performance of HAA (no leverage, backtest results, January 2, 2020–June 29, 2024)
Relative performance of CSMOM, MOMMF, HAA, DYNMOM, and SPY ETF

The orange line shows the performance of the HAA with a 50% allocation to CSMOM (gray line) and MOMMF (blue line). Since 2020, the total return for HAA is 71.4%, and for SPY ETF, it is 81.3%. Below is a performance comparison table.
| HAA | SPY ETF | |
| Annualized return | 13.0% | 13.9% |
| Total return | 71.4% | 79.5% |
| Maximum drawdown | -5.9% | -33.7% |
| Equity volatility | 8.9% | 21.6% |
| Equity Sharpe ratio | 1.47 | 0.64 |
| Equity Beta (S&P 500) | 0.24 | 1.00 |
The Sharpe ratio of HAA is more than double that of a buy-and-hold SPY ETF. The maximum drawdown is less than 20% of the drawdown of the buy-and-hold SPY ETF. The annualized return of HAA is lower by 90 basis points as compared to buy and hold, but there is a significant improvement in risk-adjusted returns.
Equity Performance (No leverage, backtest results, January 2, 2020–June 28, 2024)

The annualized return is 13%, with a 5.9% maximum drawdown. The Sharpe ratio is 1.47.
Long-term backtests (December 31, 2007–December 29, 2023)
Equity Performance
Note that due to using the underline index for the managed futures ETF, there may have been small deviations in performance in the last few years due to tracking errors.
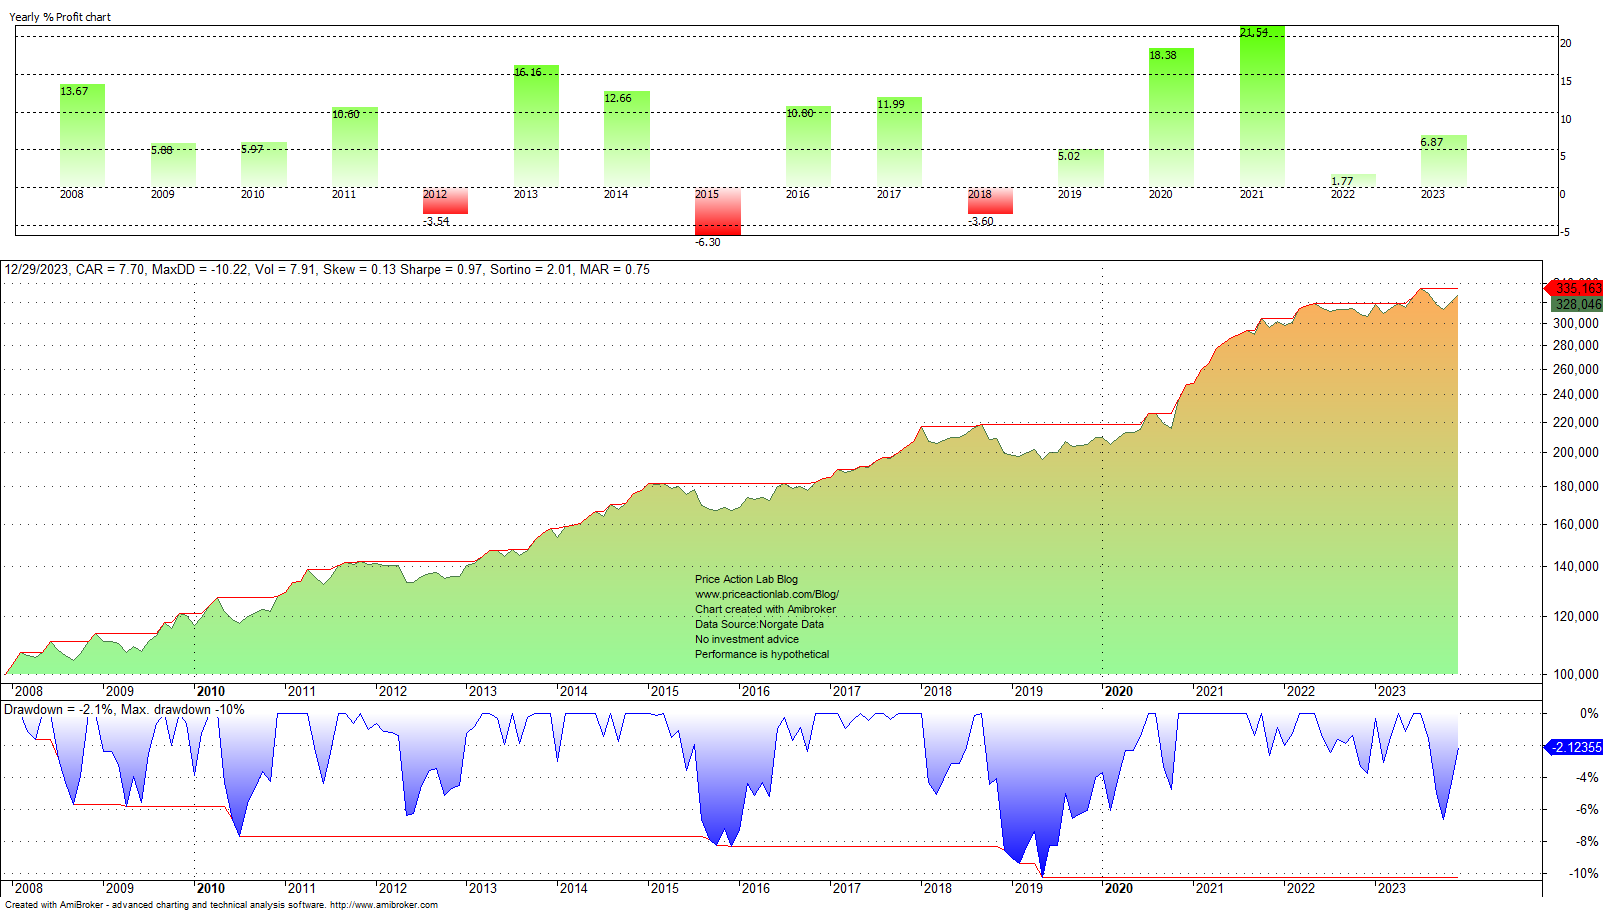
The annualized return is 7.7%, with a 10.2% maximum drawdown. The Sharpe ratio stands at 0.97. These results allow the application of 2X leverage below.
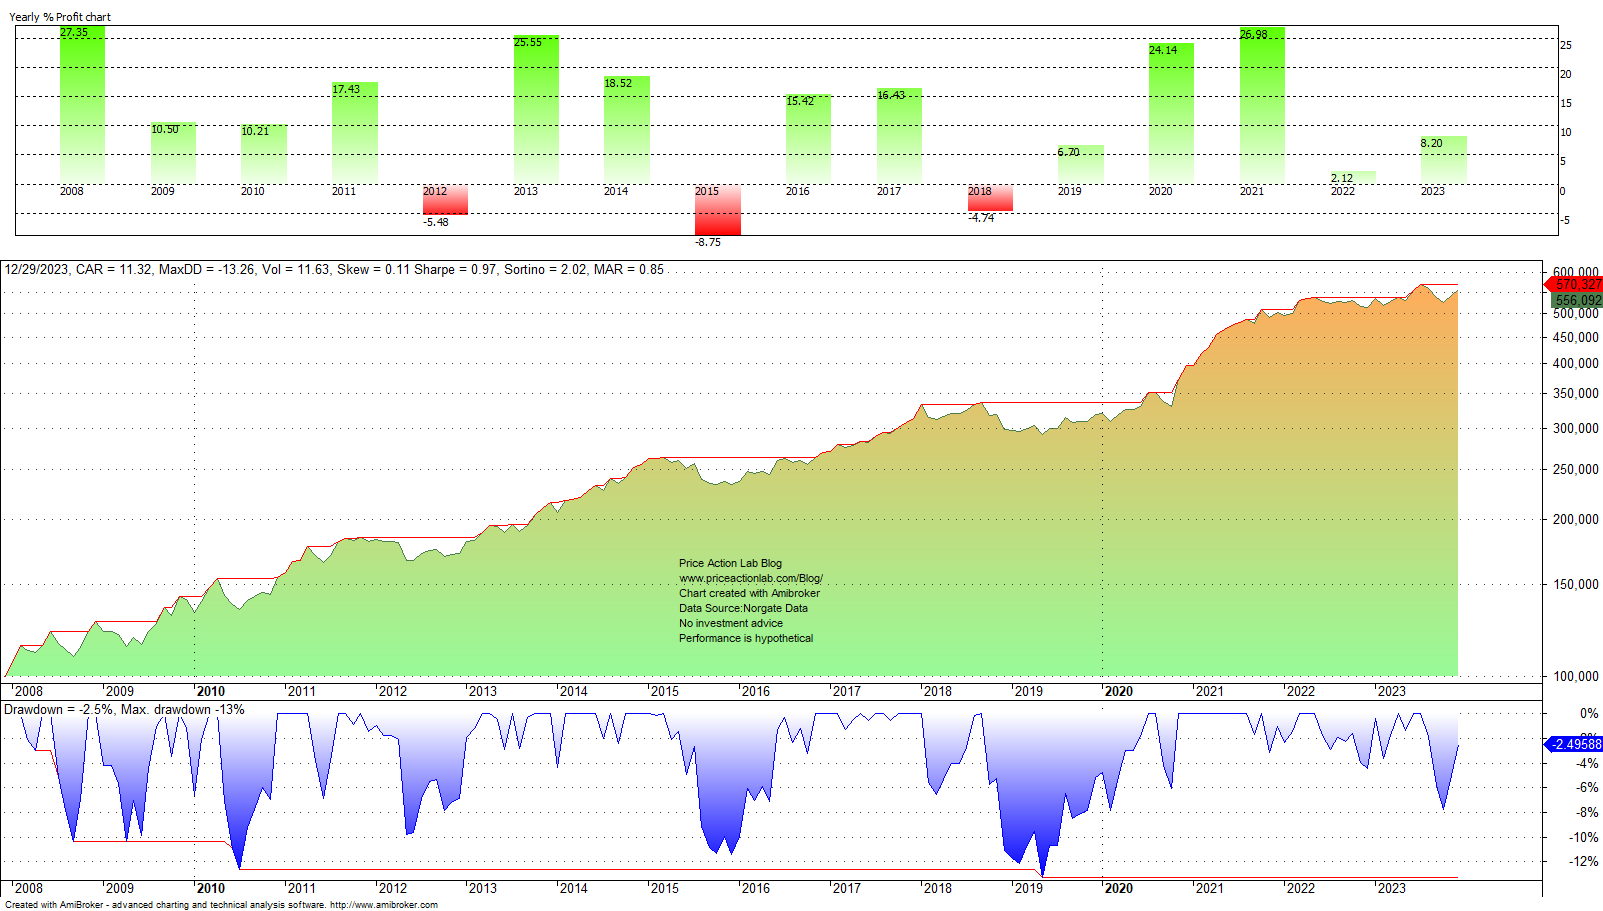
The annualized return is 11.3%, with a 13.3% maximum drawdown. The Sharpe ratio stands at 0.97.
Q&A
|
This post is for paid subscribers
Already a subscriber? Sign in |
Disclaimer: Investing in any market, including exchange-traded products (ETPs, ETFs, and ETNs), could result in a total loss of capital. We only provide the hybrid asset allocation signals (signals) for informational purposes, not as investment advice. We do not warrant the accuracy, completeness, fitness, or timeliness of the signals for any particular purpose. You should never treat the signals as financial advice. At times, we may hold positions, long or short, calls or puts, in several exchange-traded products listed in these reports. The author of this website is not a registered financial adviser. Before subscribing, please read our Disclaimer and Terms and Conditions.
We strictly prohibit any unauthorized copy, reproduction, distribution, publication, display, modification, or transmission of any part of this report without prior written permission.