


I present evidence of the underperformance of the CTA group in the last 10 years and statistical analysis to rebut claims that the performance of a group of top 20 CTAs is more representative of this group’s performance.
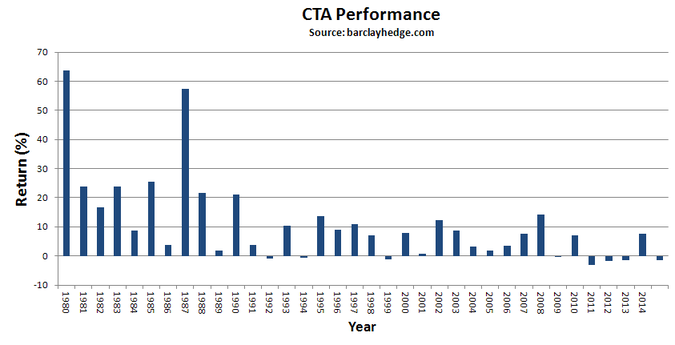
Below are yearly returns from the Barclay Index that is comprised of 535 CTAs.
Some think that the index of 20 top CTAs is more representative of this group’s performance:
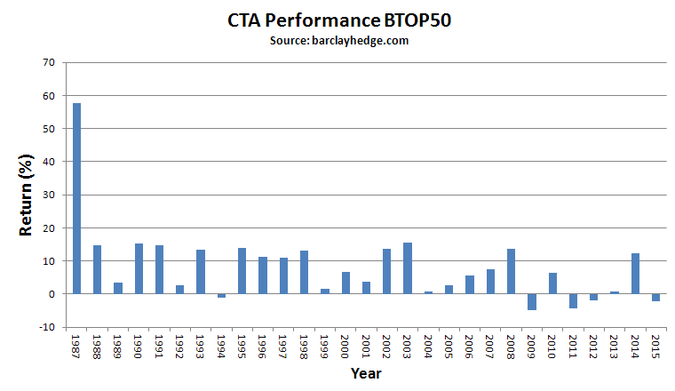
Note that the first chart starts in 1980 while the second starts in 1987. Below is a table of CAGR values for the last 3, 5, 7 and 10 years, based on the above charts and compared to S&P 500 total return:
| 3-yr CAGR | 5-yr CAGR | 7-yr CAGR | 10-yr CAGR | |
| CTA (535) | 1.53% | -0.06% | 0.092% | 3.09% |
| CTA (20) | 3.41% | 0.78% | 0.74% | 3.11% |
| SP500TR | 14.91% | 12.5% | 14.95% | 7.24% |
The underperformance of CTAs even in the 10-year period that includes a 55% drawdown in S&P 500 is evident. In recent years the underperformance has accelerated, both in absolute terms and relative to S&P 500 total return. Annualized returns in the last 5 years of -0.06% and 0.78% for the group of 535 and 20 top, respectively, is nothing to brag about. But is it possible that the top 20 group has a better ability in generating absolute returns? This question is answered after performing a paired t-test on data from yearly returns for the two groups:
| Mean | Standard deviation | |
| CTA (535) | 0.0881 | 0.1465 |
| CTA (20) | 0.0855 | 0.1159 |
The T-value is 0.6633, indicating no difference in the two means. Thus, the argument that the Barclay CTA Top 20 index is more representative of CTA returns is rejected.
The variance of returns of the top 20 group is lower, as expected. However, the non-significant results is an indication that they are not able to do better than the large group. This should be expected since they are trading the same markets, mostly with the same tools and strategies.
Obviously, some CTAs do better than others by virtue of a distribution of a population. This analysis dealt with averages and average performance and it is not an indication of how a particular CTA or program has performed or will perform in the future.
If you found this article interesting, I invite you follow this blog via any of these methods: RSS or Email, or follow us on Twitter
If you have any questions or comments, happy to connect on Twitter: @mikeharrisNY
Charting and backtesting program: Amibroker
Technical and quantitative analysis of Dow-30 stocks and 30 popular ETFs is included in our Weekly Premium Report. Market signals for longer-term traders are offered by our premium Market Signals service. Mean-reversion signals for short-term SPY traders are provided in our Mean Reversion report.


