


Update on the performance of a long/short strategy that trades Dow 30 stocks in the daily timeframe. This strategy is for professional traders and funds with sufficient capital and low execution cost.
The long/short equity strategy is based on features developed by DLPAL LS. The large sample and the positive performance during the 2008 bear market but also during 2011 and 2018 corrections demonstrate the predictive power of the features generated by DLPAL LS software for developing institutional grade strategies to be used in diversifying stock market left tail risk.
More details about the strategy and the feature structure can be found here, here and here.
Backtest details
Time-frame: Daily (adjusted data)
Strategy type: Long/short equity
Universe: 30 Dow stocks from current composition
Backtest period: 01/02/2008 – 07/26/2019
Maximum open positions: 30 (not dollar neutral)
Commission per share: $0.005
Position size per stock: Equity/30
Position entry and exit: Open of next bar
Performance details
| Parameter | Strategy | B&H (SPY TR) |
| CAGR | 8.6% | 8.6% |
| Max. DD | -9.5% | -52.4% |
| Sharpe | 0.95 | 0.44 |
| MAR | 0.72 | 0.17 |
| All Trades | 17839 | – |
| Long trades | 8928 | – |
| Short Trades | 8911 | – |
| Win rate | 52.6% | – |
These types of strategies are suitable only for those with direct access to a prime broker that offers low cost execution and liquidity search algos that minimize slippage. These are not strategies for retail traders because they try to exploit small idiosyncratic edges. There are a number of significant steps to convert the idea to an automated strategy that often involve hundreds or even thousands of lines of code depending on specifications.
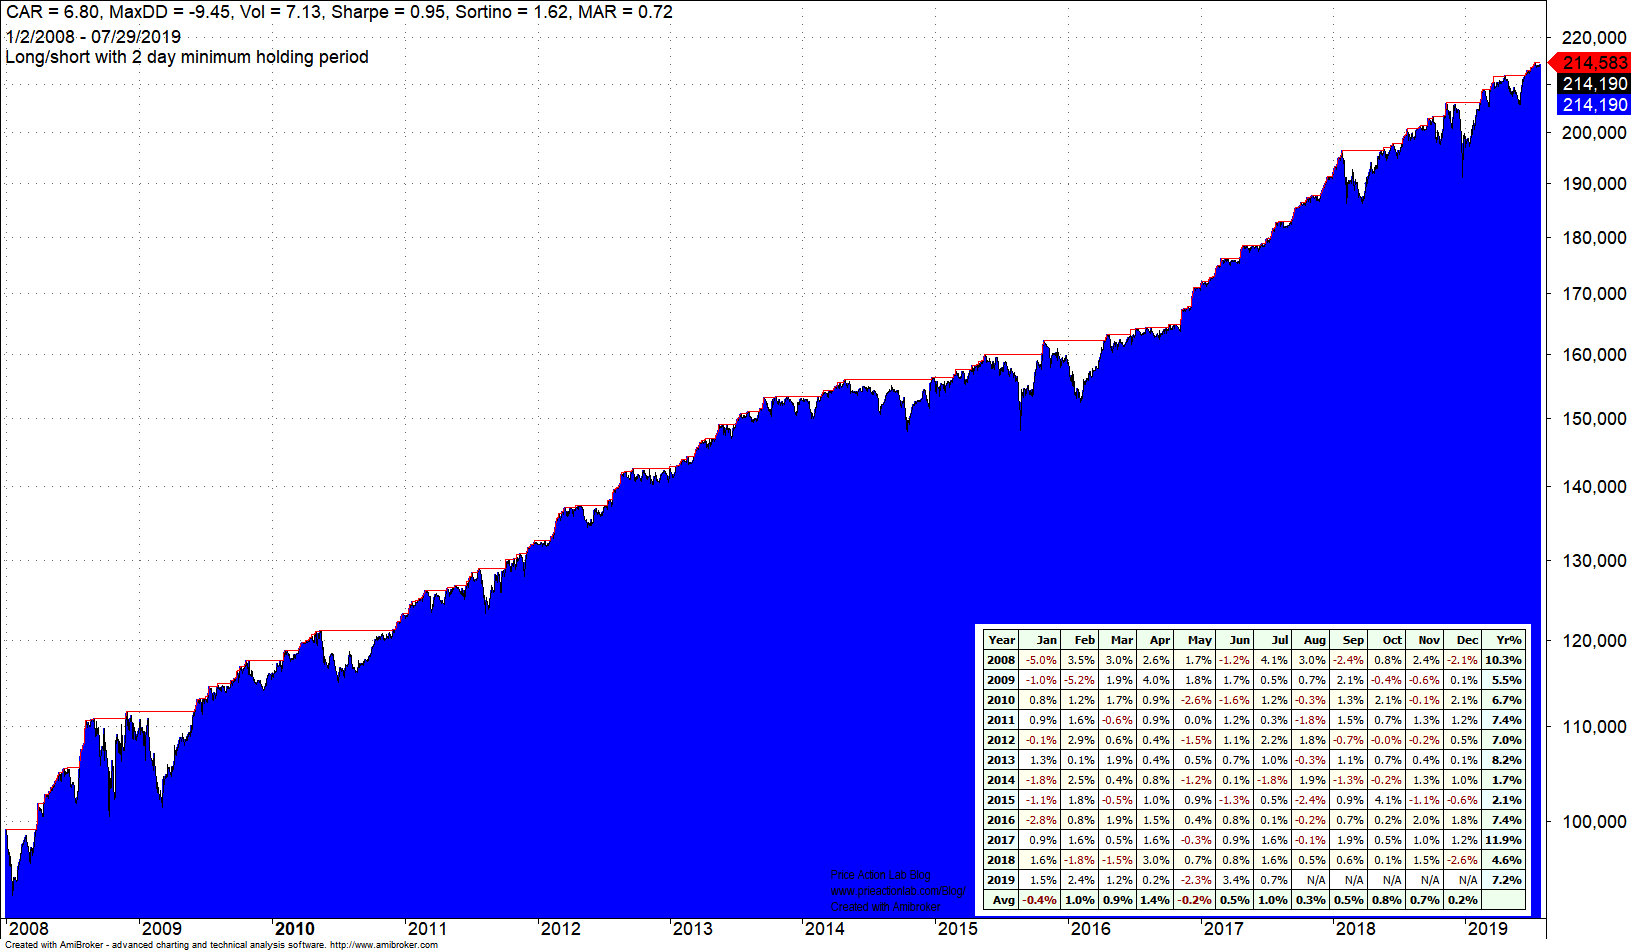
The strategy matched SPY buy and hold return but at much lower drawdown. Sharpe for the strategy is close to 1 versus below 0.5 for buy and hold. The trade sample is very large and impact of friction high, therefore performance is sensitive to execution cost. In 2008 return was about +10% versus -36% for buy and hold. Return was also positive during 2011 and 2018 corrections. There is no losing year since 2008.
More details about DLPAL LS can be found here. For more articles about DLPAL LS click here.
If you have any questions or comments, happy to connect on Twitter: @priceactionlab
Strategy performance results are hypothetical. Please read the Disclaimer and Terms and Conditions.


