


If there is one thing that is certain in the markets, it is the drawdown. Here are some facts.
In the last 10 years in financial social media, panic has been predominant after a small correction from all-time highs. Permabears always cease the opportunity after a 2% or 5% drop to publish charts with confirmation bias about pending collapse based on tiny samples of what occurred in the past. Financial media holds special shows where analysts try to fit random patterns to price action and rationalize what will be next. Yet, drawdown is the only certainty in the markets; it is the certain event. Here are some charts that demonstrate this.
The S&P 500 index since 1940 has been in 5% or larger drawdown from all-time highs about 47% of the time and about 33.5% of the time it has been in a drawdown of more than 10%, as shown below.
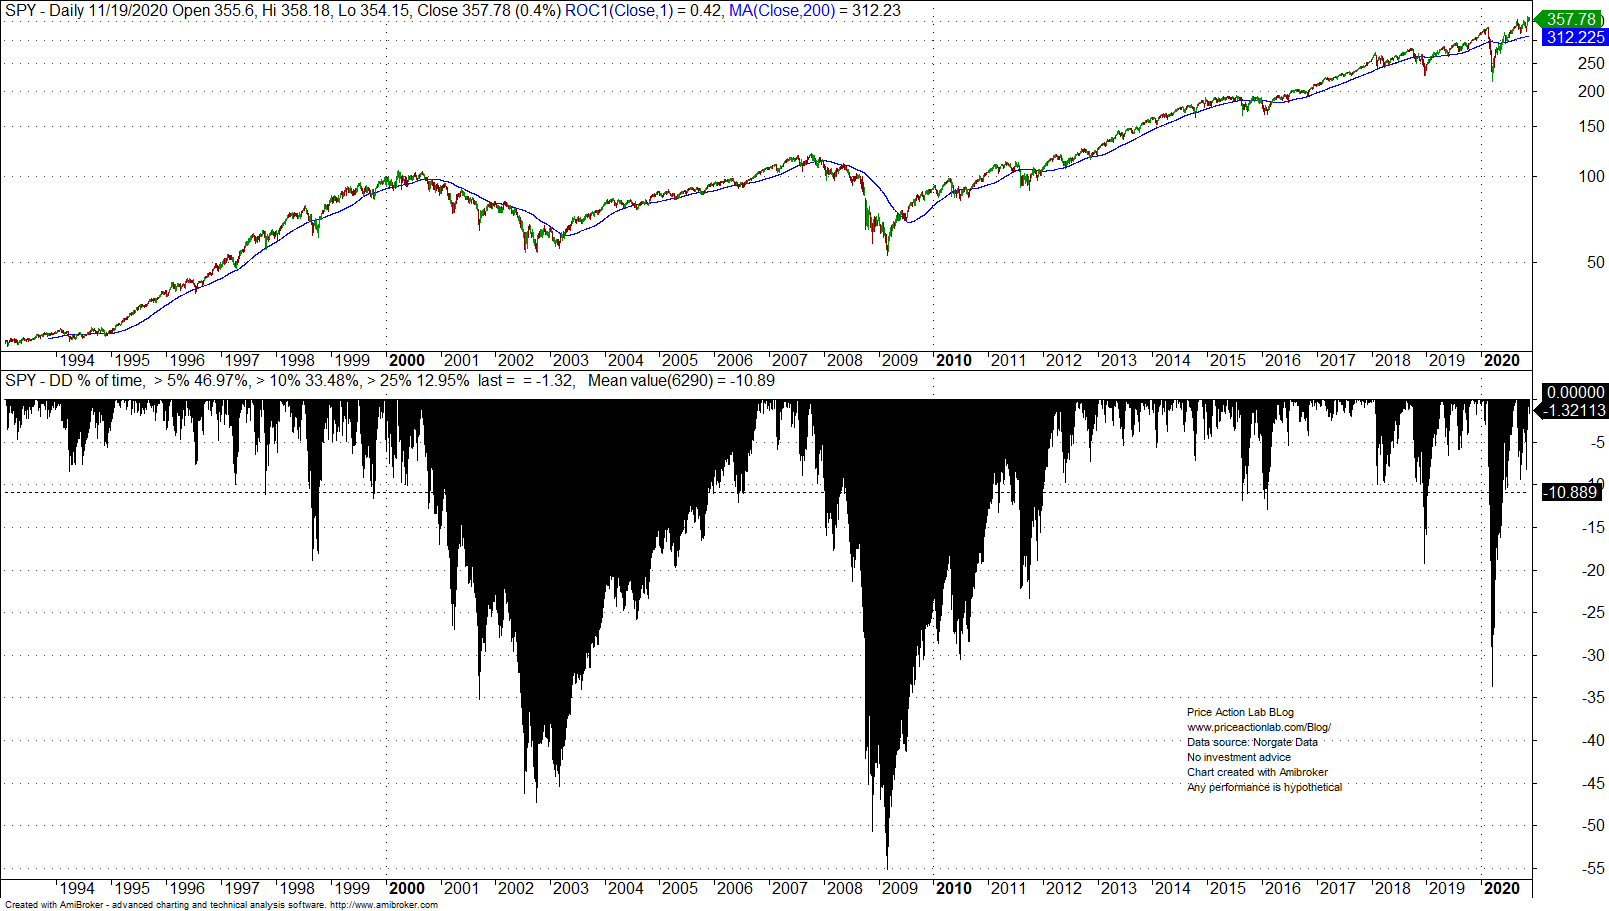
About 13% of the time, the S&P 500 index has stayed 25% or more below all-time highs. Yet, panic erupts in social and financial media when there is a 2% drop from all-time highs.
Below is the equity curve of the popular long-only price/12-month moving average cross.
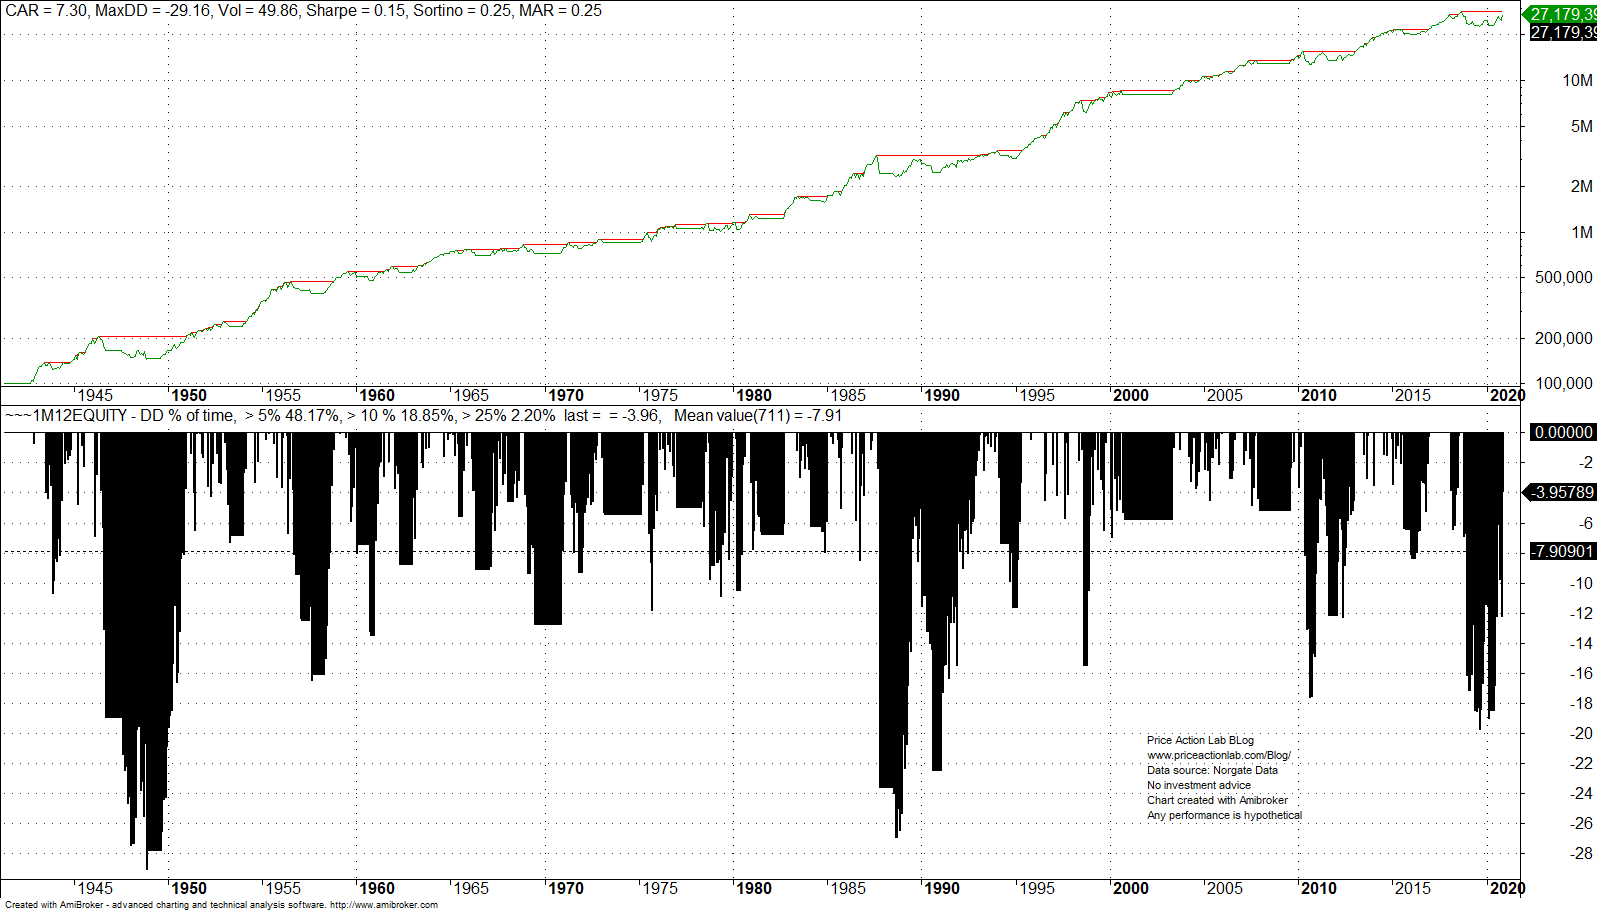
This simple monthly strategy has been in a drawdown of 5% or more about 48% of the time but has managed to reduce the frequency of drawdown levels of 25% or more to about 2.2% of the time, as compared to 13% for buying and holding. This is a remarkable achievement for a simple strategy, but it has also been lucky not to encounter multi-year sideways markets with strategy losses, in this case compounding and buy and hold outperforming.
Let us look next at the 60/40 SPY/TLT portfolio performance since 2004.

This simple allocation scheme has been in a drawdown of 5% or more only 14.7% of the time, and more importantly, in a drawdown of 25% or more just 0.2% of the time. This is a huge improvement over trend-following and buy and hold. However, the 60/40 portfolio has never encountered stagflation, i.e., a situation when both stocks and bonds fall and the allocation does not come without high risks.
Finally, let us look at the maximum drawdown distribution of CTA. Only those CTAs that are still active are included. I used data from nilssonhedge.com to generate the distribution of CTA maximum drawdown.
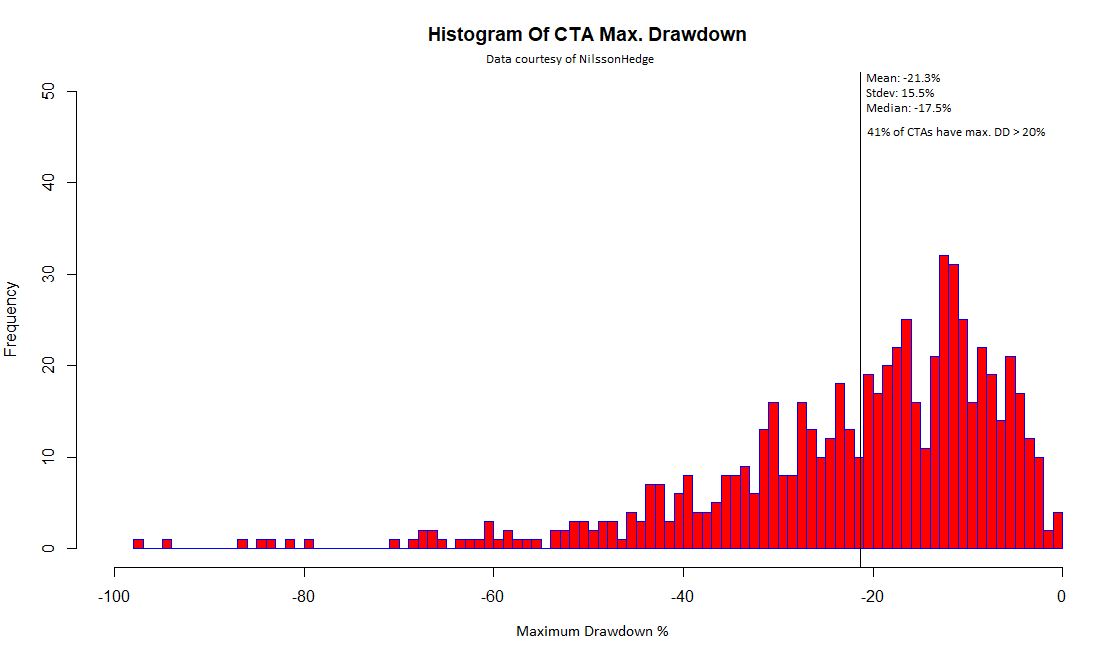
About 41% of the CTAs in the database (total is 640) have had maximum historical drawdown of more than 20%. The mean maximum drawdown is -21.3%. There is no way to generate alpha without accepting higher drawdown.
It gets worse: those who try to avoid drawdowns usually underperform. The bulk of the alpha is often generated by a few trades and the filters added to protect against drawdown usually also filter out some or even all of those highly profitable trades that provide the alpha.
Everyone has to learn to live with drawdown because it is the only certainty in the markets.
Charting and backtesting program: Amibroker
Data provider: Norgate Data
If you found this article interesting, you may follow this blog via push notifications, RSS or Email, or in Twitter


