


As long as there are markets and market participants, there will always be market anomalies. Some market anomalies disappear but new ones always emerge.
Market anomalies emerge in all timeframes due to the complexity of markets. These include seasonality, calendar effects, price action patterns, price series and cross sectional momentum, divergences between price and indicators, support and resistance, to name a few. In fact, some anomalies may emerge, disappear and then reemerge. But what do we mean by anomalies emerging and disappearing?
Basically, emergence and disappearance have to do with some measures of profitability. There is always some metric that determines whether a market anomaly is present and in most cases is it a function of the reward and risk from trading a sufficient sample of occurrences of the anomaly. Let us call the sample n, the reward mean return µ and the risk σ. Then the metric is in abstract form given by:
f(µ, σ, n) (1)
In identifying anomalies a minimum sample is usually required otherwise it does not make sense to even consider them. For example, an anomaly with n = 2 in daily timeframe will not offer any statistical significance. We need a high n depending on the timeframe. Therefore, there is a constraint on n. There is also a constraint on µ for the anomaly to have economic value. Then, σ must also be constrained; a market anomaly with high volatility is usually not desirable for trading purposes.
Therefore, identifying market anomalies is an optimization problem subject to constraints:
| max f(µ, σ, n) (2) |
| s.t. n > nmin |
| µ > µmin |
| σ < σmin |
Obviously, the metric may involve additional or different parameters based on objectives and the constraints will change accordingly. The above is just an example.
From the optimization problem above we can get an idea why market anomalies emerge and disappear. As markets evolve and due to non-stationary price series the constraints may not be satisfied for a period of time but then after some time they may be satisfied again.
Or, at some stage of market anomaly detection, some potential ones do not quality but after more data are available they do.
It is the non-stationarity of price series that actually gives rise to market anomalies and also the same property that makes them disappear. Without non-stationarity profits may not be possible.
Some anomalies appear to have economic justification but most do not have one, at a least an obvious one.
Therefore, looking for market anomalies is a never-ending task for most traders. Catching the fresh one that has just emerged and positioning early is a key to trading profits. Many traders do not realize that when they go long or short based on any justification, technical or fundamental, they essentially bet that there is a market anomaly in place that will generate profit. Although profit may be generated randomly without the presence of an anomaly, the underlying trading is random with zero mean return before commissions.
In order to profit in the longer-term, on top of unavoidable random trades that result in zero mean return and hopefully low standard deviation, a sufficiently high return that arises from successfully trading market anomalies must be superimposed. This is not easy in any timeframe but it has been less difficult for some time in longer timeframes and when taking advantage of the persistent price series momentum anomaly in the US stock market.
Below is an example of a price series momentum market anomaly in S&P 500:
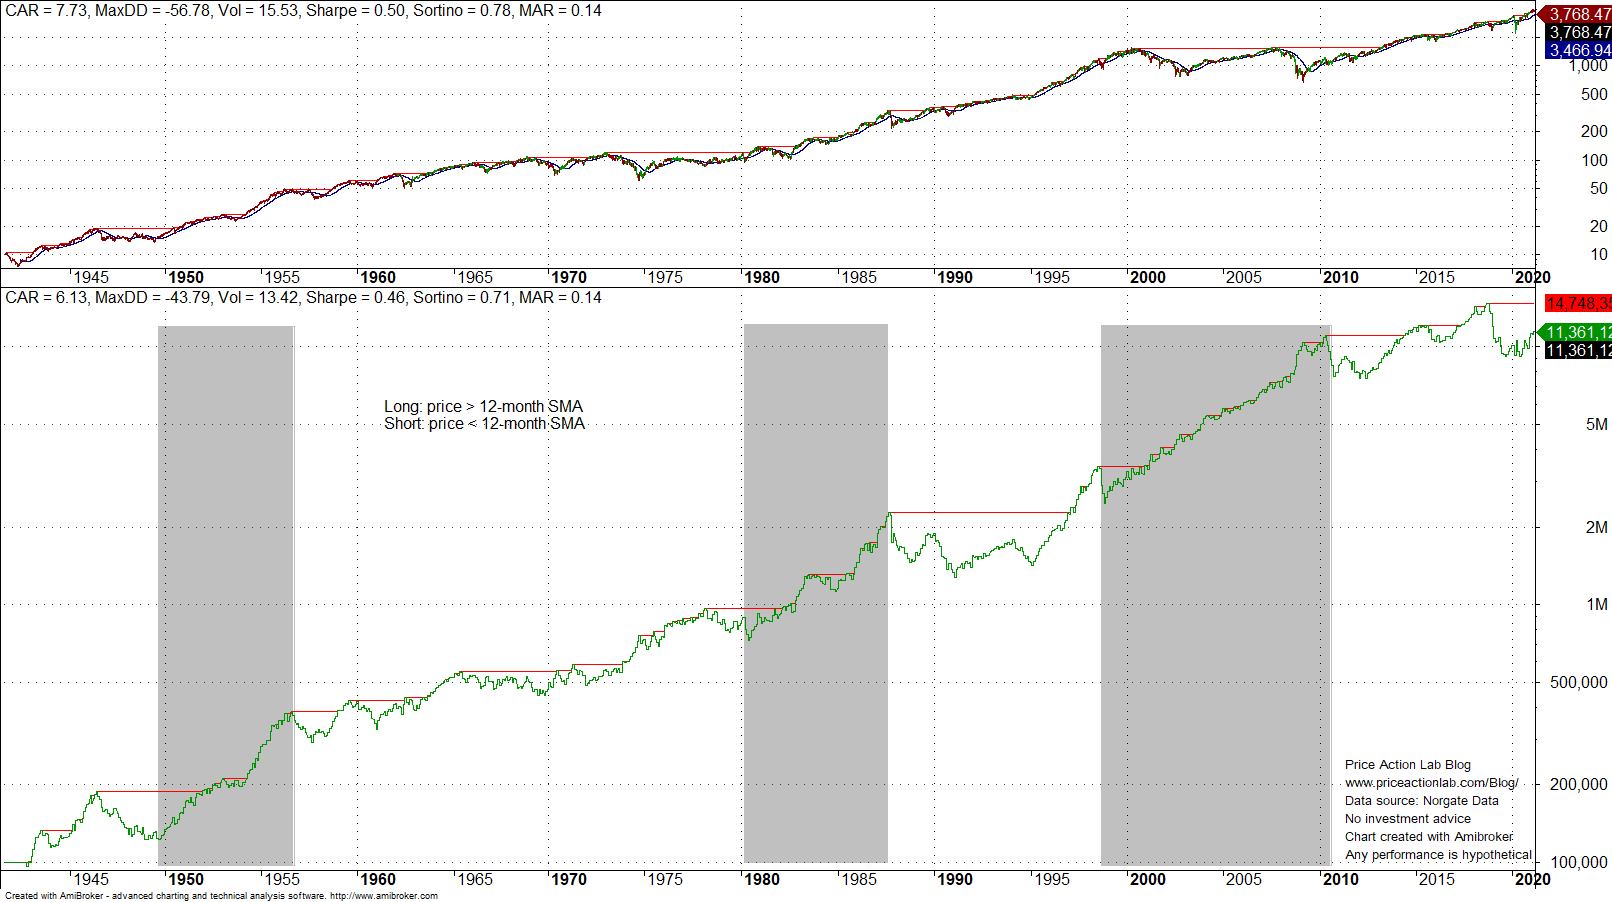
There are thousands of articles and hundreds of books with claims this is a persistent anomaly. These claims are naïve for most part and result of a chart illusion bias. The truth is this anomaly emerges, disappears and reemerges depending on evaluation periods. I have marked three periods when this anomaly worked well. In the remaining periods the anomaly has not delivered performance to justify trading or investing based with it.
For example, for a period of seven years from 01/88 to 12/94, annualized return is -2.8% and total return is -18%. This is a long enough period to conclude that the anomaly had disappeared. But when looking at the long-term equity, it appears this is an aberration but that it only due to bias.
Especially after 2019, the volatility of the equity curve for fully invested equity, as shown above, has increased significantly (note this is log scale.) Annualized return from 01/2019 to 03/2021 is -2.2% and total return is -4.5%. Volatility is 18.6%. Therefore, this anomaly, a.k.a. trend-following, may be disappearing again. However, we can only know for sure in hindsight. A significant edge is knowing when an anomaly will disappear ex ante. This is difficult to do.
Since mid 90s I have been working on algorithms that identify short-term market anomalies and have developed software based on proprietary detection principles. I always see new market anomalies emerging and old ones disappearing. The real edge is in the process used to determine the significance of these anomalies and how to use them in ways that increase the future expectation at sufficiently low volatility. One of my early customers used Bayesian statistics and reported excellent results. Another one recently has used machine learning classification for selecting the best anomalies from the results. There is always a higher level of edge that increases the odds of success of a lower level edge. However, using blindly anomalies from the public domain could result in disappointing performance or even severe losses.
In the case of DLPAL LS software, the algorithm calculates features based on the ensemble performance of a large number of market anomalies. Below is how this is achieved in principle:
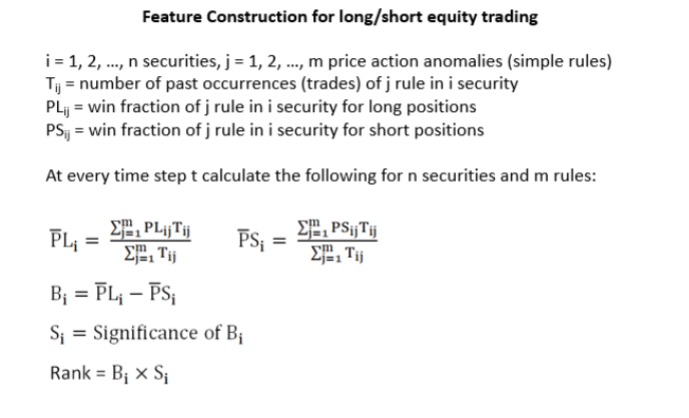
The ensembles reduce variance but increase bias and this is actually the objective in this case.
There are many ways to identify market anomalies and calculate their significance. Diversification in market anomaly space is as important as in actual markets. This is a daily battle with a low signal to noise ratio but it is interesting and challenging.
Charting and backtesting program: Amibroker
Data provider: Norgate Data
If you found this article interesting, you may follow this blog via push notifications, RSS or Email, or in Twitter

Click here to subscribe


