


Since July of this year, the SPY ETF is up 6.1%, with the regular trading hours gains at 9.2%, and a loss of 3.1% in overnight. Possible causes of this significant reversal of a multi-year trend are listed.
The multi-year trend of this well-known overnight anomaly is shown in the chart below.
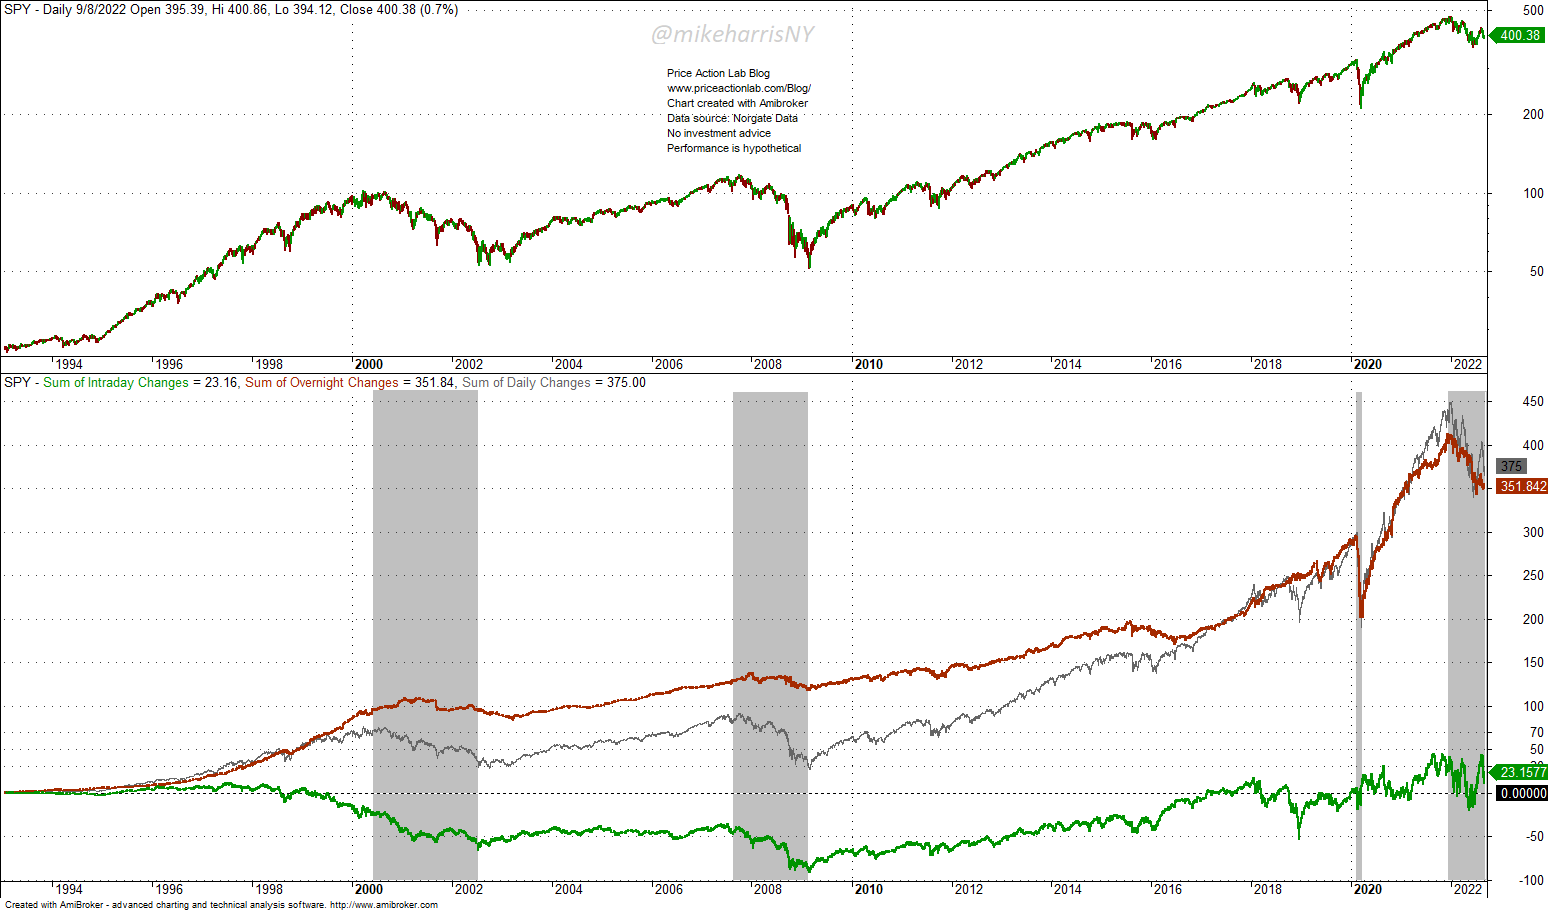
Until 2017, the overnight anomaly (ON) was the strongest or the fact that all the gains in SPY ETF had been realized overnight (red line).
After 2017, regular trading hours (RTH) gains (green line) have been volatile with periods of positive performance. This year we notice a significant reversal.
A change in the dynamic started during the 2020 crash. As it may be seen from the above chart, ON crashed and there an was increase in RTH activity.
A similar reversal occurred during the crash of this year, but RTH gains have increased considerably after July.
Note that in the last two major bear markets, ON gains were flattish, and the bulk of the losses came during RTH.
Therefore, the current dynamic represents a significant change in dynamics as compared to the past. The RTH gains after June (green line) are significant, as compared to the loss during ON (red line), as shown below.
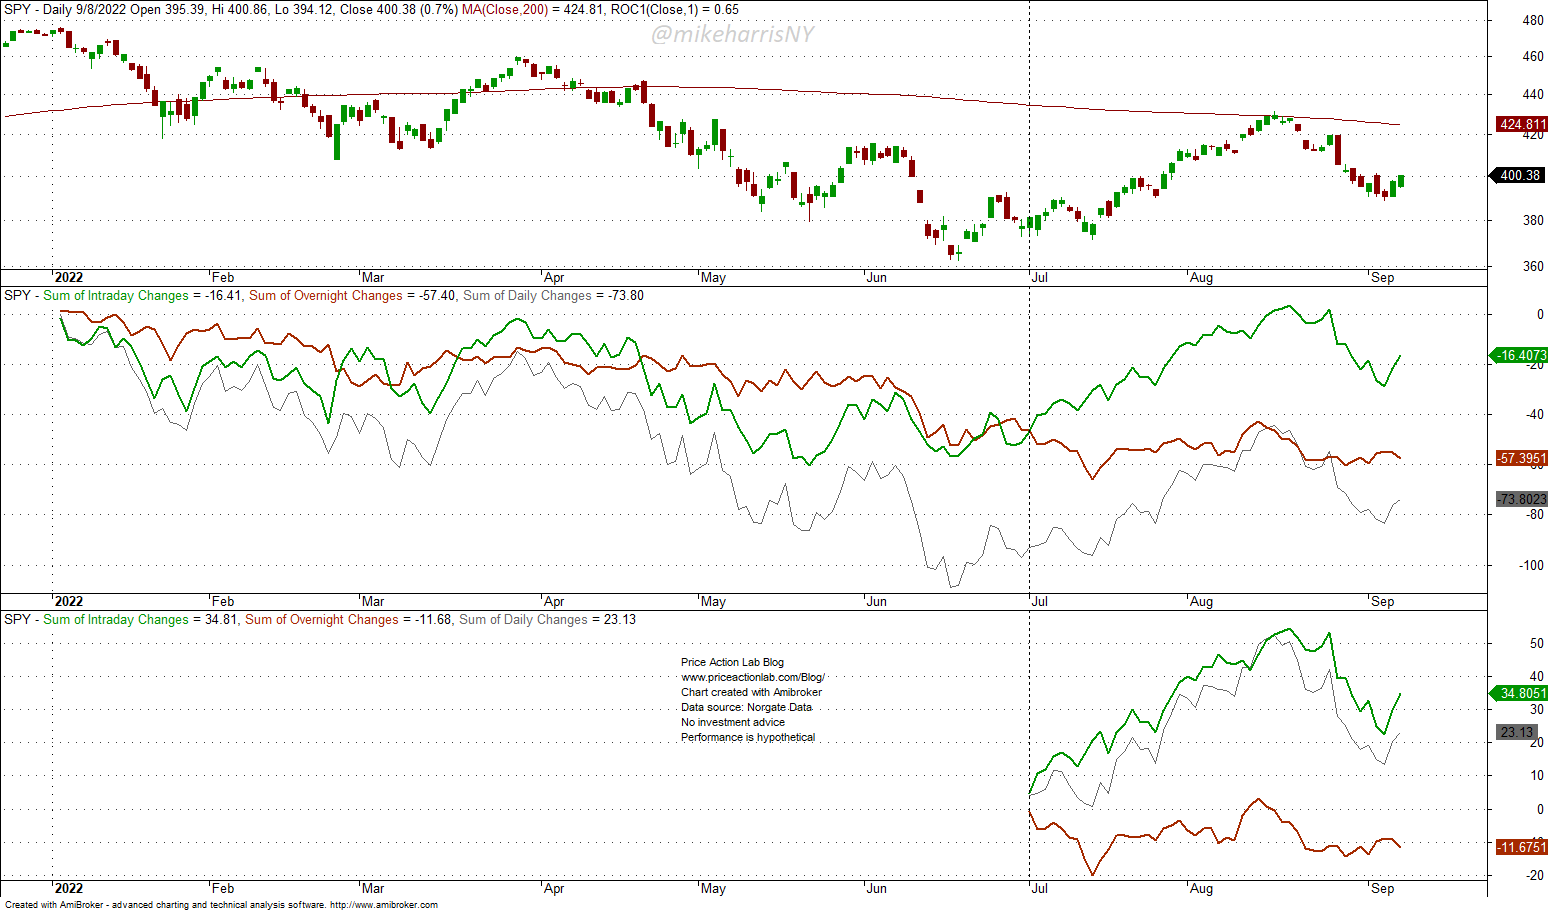
Since July 1 of this year, RTH shows gains of 9.2%, while ON has a loss of 3.1%. This reversal also coincides with the launch of ETFs designed to take advantage of overnight gains.
Some of the potential causes of this significant reversal in a multi-year anomalous price action may be normalization due to arbitrage (ETFs and the anomaly getting publicity due to articles and even academic papers.)
However, normalization of this magnitude due to arbitrage of trading activity is unlikely.
Another possibility is that RTH gains are due to options dealer hedging. Dealers are buying into strength and selling into weakness.
Another possibility is large macro bets by passive and other funds that believe the Fed will pivot due to a recession. These bets are made during RTH for better liquidity and minimal effect on prices.
All a combination of the above may be the cause of this notable reversal, already noted by active traders with many years of market experience.
As @mikeharrisNY has mentioned, there has been an increase in directional trading during RTH and a notable drop in overnight activity since June. That trend seems to be continuing in September. Algo returns have normalized considerably as the short equity curve has flattened.
— Alex Fleming (@hughesanalytics) September 9, 2022
It is still early to declare this reversal in a multi-year anomaly as permanent but if this happens, it will be an interesting development, and probably several Ph.D. degrees will be awarded to explain it.
Premium Content 10% off for blog readers and Twitter followers with coupon NOW10
Disclaimer: The premium articles are provided for informational purposes only and do not constitute investment advice or actionable content. We do not warrant the accuracy, completeness, fitness, or timeliness for any particular purposes of the premium articles. Under no circumstances should the premium articles be treated as financial advice. The author of this website is not a registered financial adviser. The past performance of any trading system or methodology is not necessarily indicative of future results. . Read the full disclaimer here.
Charting and backtesting program: Amibroker. Data provider: Norgate Data


