


The belief that recent volatility in the forex market is high is not true by historical standards and is probably the result of recency bias.
On Friday, September 23, 2022, the British Pound fell 3.6% against the US dollar, an equivalent of 411 pips in forex traders’ terms, after the announcement of an economic plan to stimulate growth.
Social and financial media accounts referred to an extraordinary volatility in currency markets, but this is only due to recency bias, as we will show below.
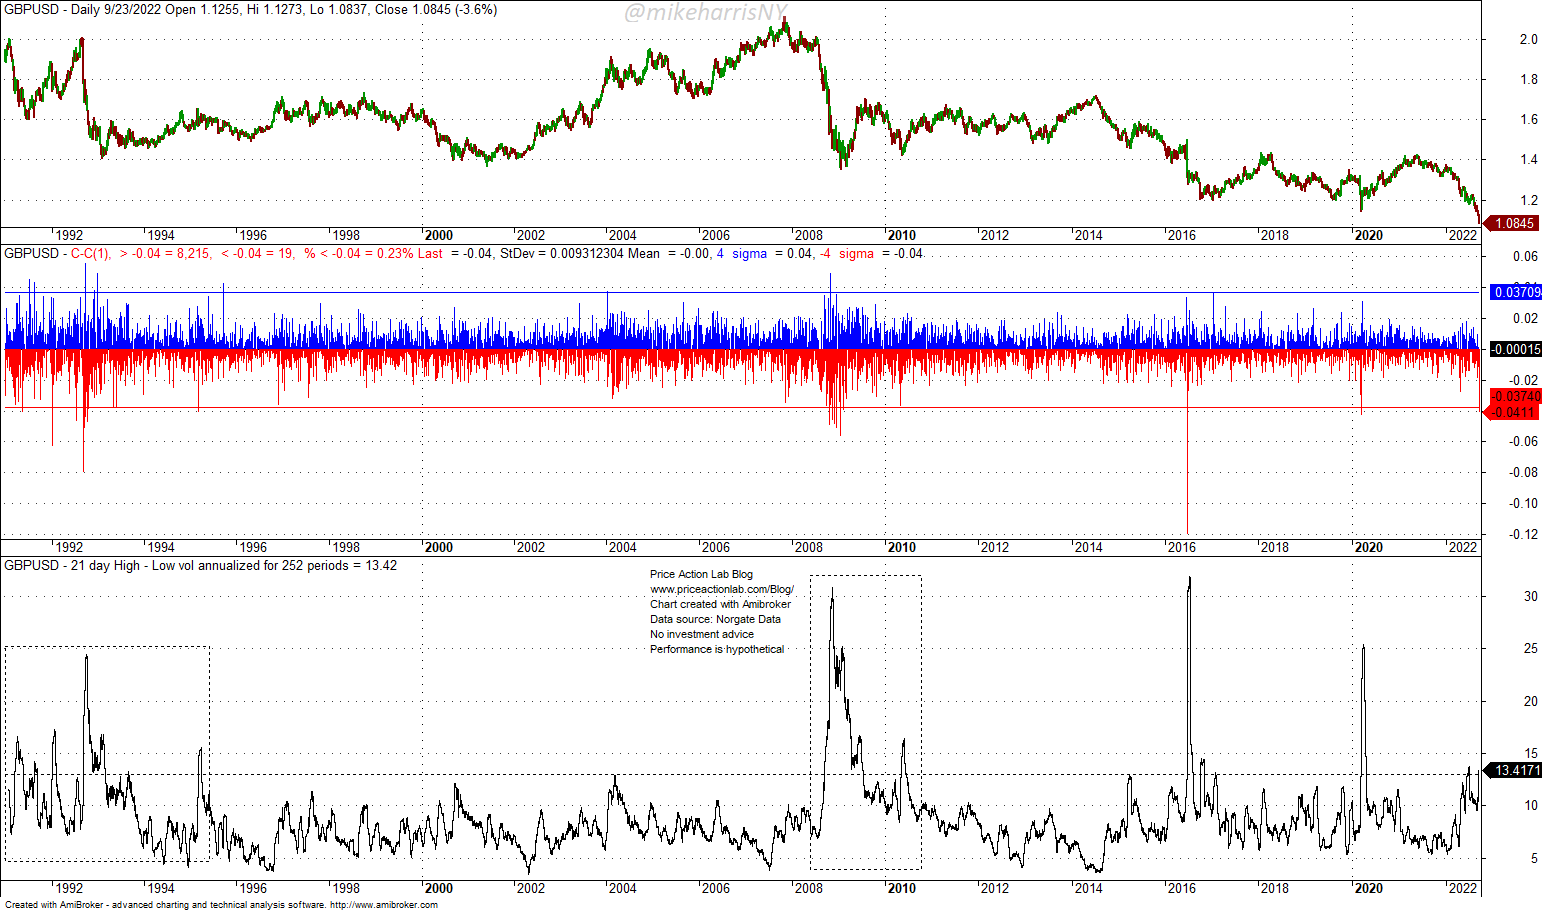
The GBPUSD spot exchange rate above shows the daily changes (first differences) in the middle chart and also the annualized 21-day High-Low volatility.
Specifically, a drop of more than 400 pips on a day, or a 4-standard deviations down move based on available sample since 1990, has occurred 19 times in the past, and most of those occurrences were in the early 90s and during the GFC.
In addition, the current annualized 21-day High-Low volatility is at 13.4%, much below the levels that occurred during the early 90s and also during the GFC.
Since 2012, forex markets have been relatively calm, with volatility rising only briefly during the 2020 pandemic crash. There was also a period of calm in forex markets from about 2000 to 2008, before the GFC erupted. This can be seen from the US dollar index chart below.
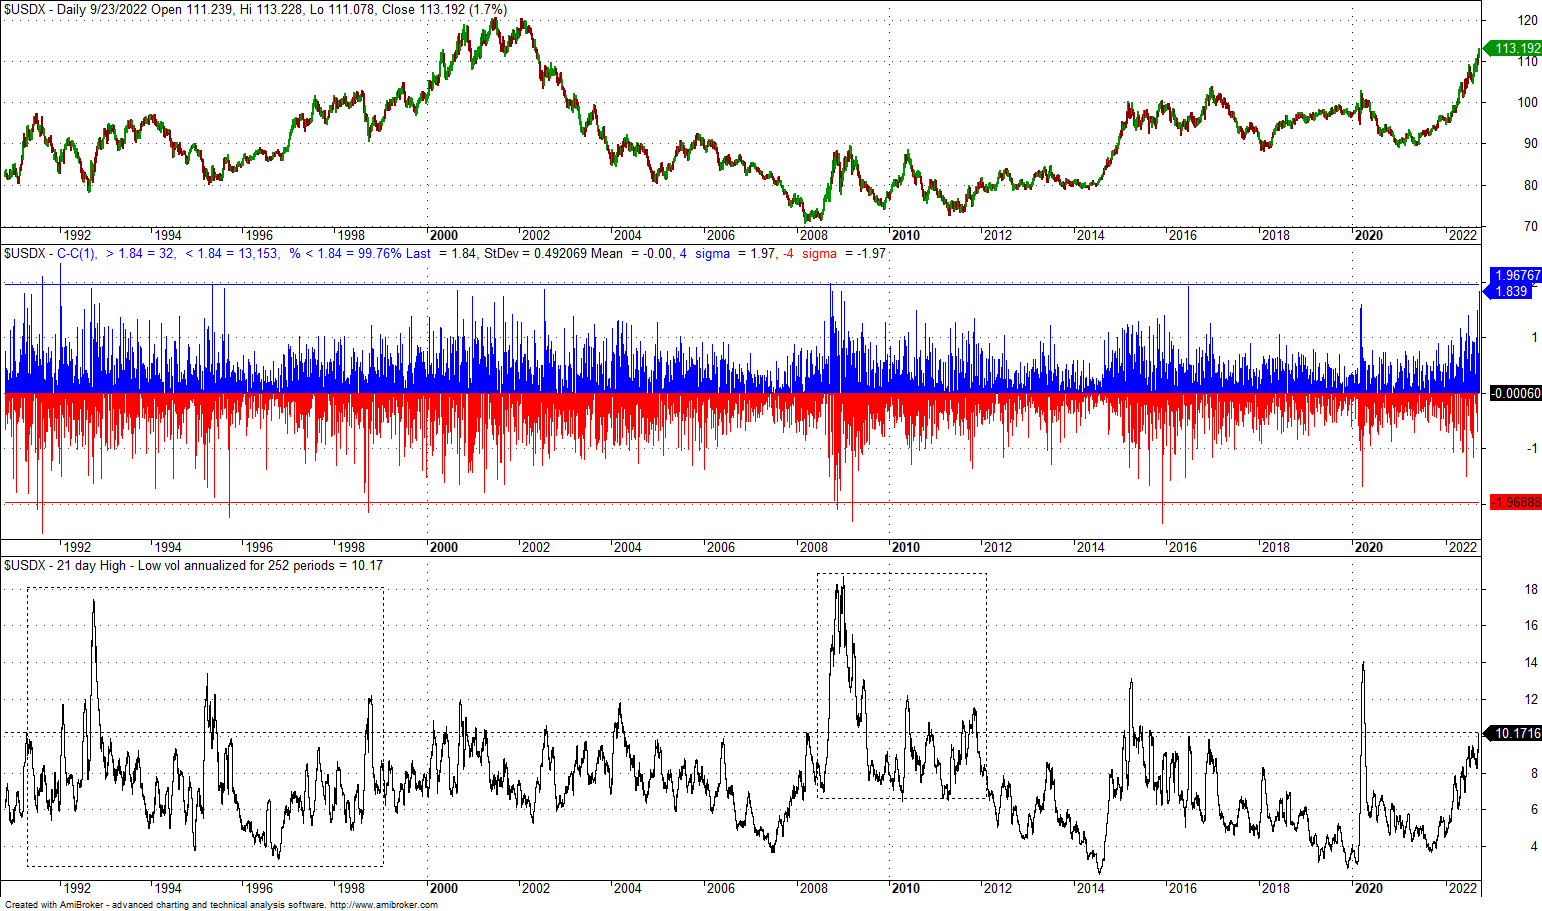
The current annualized 21-day high-low volatility of the US dollar index is 10.2%, which is much below the levels reached in the 90s and also during the GFC.
Although the price move on Friday, September 23, 2022, was about four-standard deviations based on the available sample, similar or even stronger moves have occurred 32 times since 1990.
The belief that recent volatility in the forex market is very high is due to recency bias: the forex markets have been relatively calm for many years before the recent volatility spike, but in the 90s, for example, volatility was at much higher levels and persistently so.
Premium Content 10% off for blog readers and Twitter followers with coupon NOW10
Disclaimer: The premium articles are provided for informational purposes only and do not constitute investment advice or actionable content. We do not warrant the accuracy, completeness, fitness, or timeliness for any particular purposes of the premium articles. Under no circumstances should the premium articles be treated as financial advice. The author of this website is not a registered financial adviser. The past performance of any trading system or methodology is not necessarily indicative of future results. . Read the full disclaimer here.
Charting and backtesting program: Amibroker. Data provider: Norgate Data


