


The share price of Meta Platforms, Inc. (META) jumped 23.3% on February 2, 2023. This stock has seen significant gaps since its IPO, both up and down, but it does not rank among the top 20 stocks with the most gaps since 2012.
In this article, “large gaps” are defined as follows:
Up gap: The day’s low is 10% above the previous day’s high.
Down gap: The day’s high is 10% below the previous day’s low.
Based on the preceding definitions, the following chart depicts significant gaps in META since 2012:
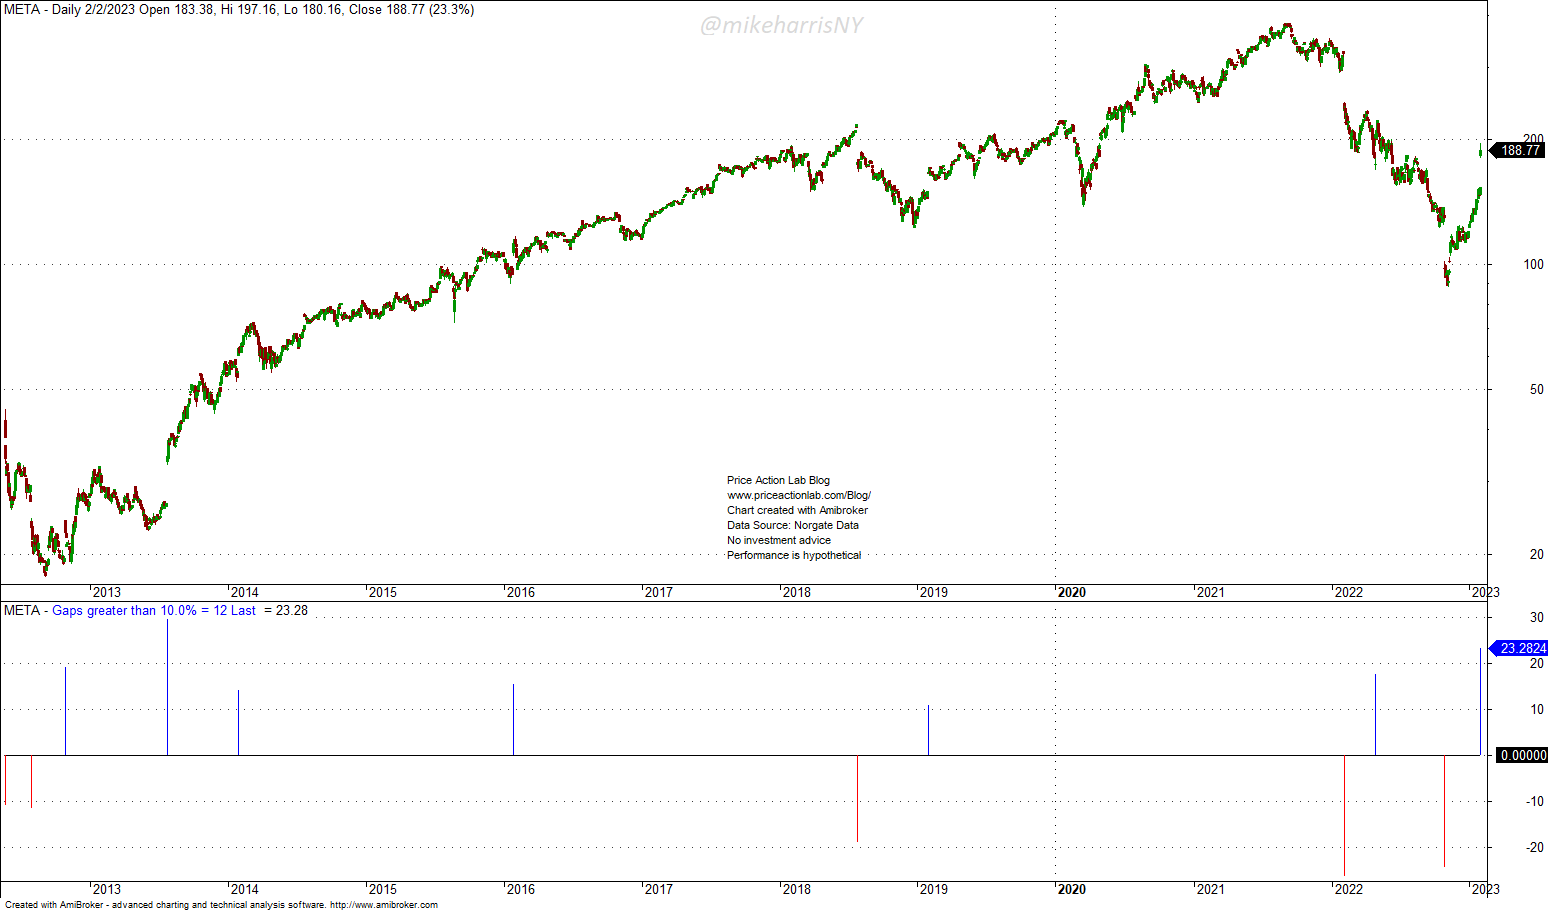
In total, there have been 12 major gaps in Meta stocks—7 up and 5 down. The list of stocks with 20 or more gaps since 2012 does not even include META. According to the aforementioned definition, TSLA, for instance, has had 39 gaps, 24 up and 15 down, yet it is ranked second.
The list of stocks with 20 or more gaps since 2012, together with their average gain or loss, is shown below.
Access to the full report requires a Premium Articles or an All-in-One subscription.
|
This post is for paid subscribers
Already a subscriber? Sign in |
Subscribe for free notifications of new posts and updates from the Price Action Lab Blog and receive a PDF of the book “Profitability and Systematic Trading” (Wiley, 2008) free of charge. Click here to subscribe.
Specific disclaimer: This report includes charts that may reference price target levels determined by technical and/or quantitative analysis. No charts will be updated if market condition changes affect the charts’ levels and/or any analysis based on them. All charts in this report are for informational purposes only. See the disclaimer for more information.
Disclaimer: No part of the analysis in this blog constitutes a trade recommendation. The past performance of any trading system or methodology is not necessarily indicative of future results. Read the full disclaimer here.
Charting and backtesting program: Amibroker. Data provider: Norgate Data
If you found this article interesting, you may follow this blog via RSS, Email, or Twitter.


