


We used the Norgate Data price series for Russell 3000 stocks with current and past constituents to determine whether breakouts or moving averages provide the most robust trend-following signals.
When backtesting trading strategies for stock index constituents, it is necessary to account for delistings and remove survivorship bias. Norgate Data offers a unique service by providing price series with current and past constituents, along with functions to access the data in backtests. We highly recommend this data service to anyone who is backtesting stock trading strategies. (We do not have a referral arrangement with the company, but the least we can do to thank the company for this service is to provide a link below.)

Our objective is to test two trend-following strategies, one based on breakouts, and the other on moving averages. Risk management is the same for both strategies.
Timeframe: Daily (adjusted data)
Index: Russell 3000 (current and past constituents)
Strategy type: Long-short (and reverse) trend-following based on breakouts or moving averages.
Maximum open positions: 150
Ranking Score: Rate-of-Change in a breakout or moving average period, top or bottom stocks. Separate rank for long and short stocks. (Used when there are more signals than maximum open positions).
Position size: Based on Equity/150
All trades are executed at the open of the next bar.
Stop-losses per position: 0.67% (100/150)
Backtest range: 01/03/2000 – 02/24/2023
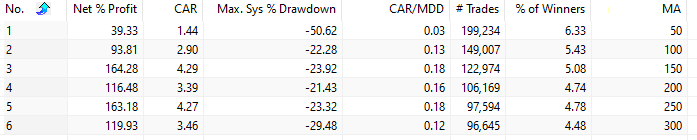
Case 1. Breakouts 50 to 350 days, in increments of 50, Top 150 stocks

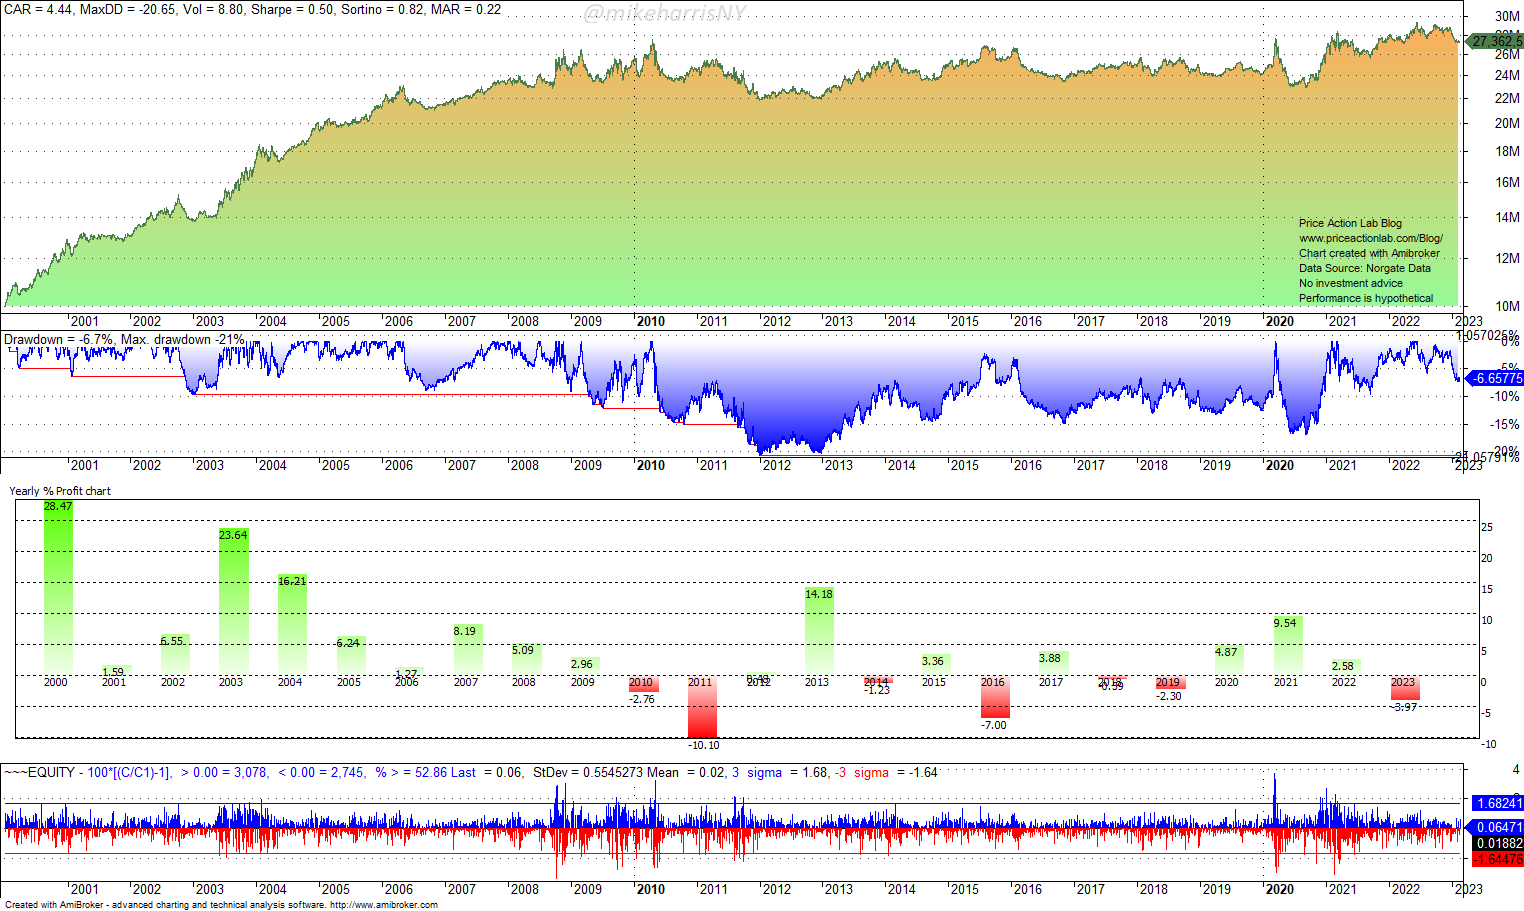
The annualized return varies from 3.32% for 50-day breakouts to 6.58% for 350-day breakouts. The win rate is very small due to the small stop-loss but the objective is to take many small losses and catch large outliers. Below is the equity curve for the 200-day breakout and top stocks, long and short.
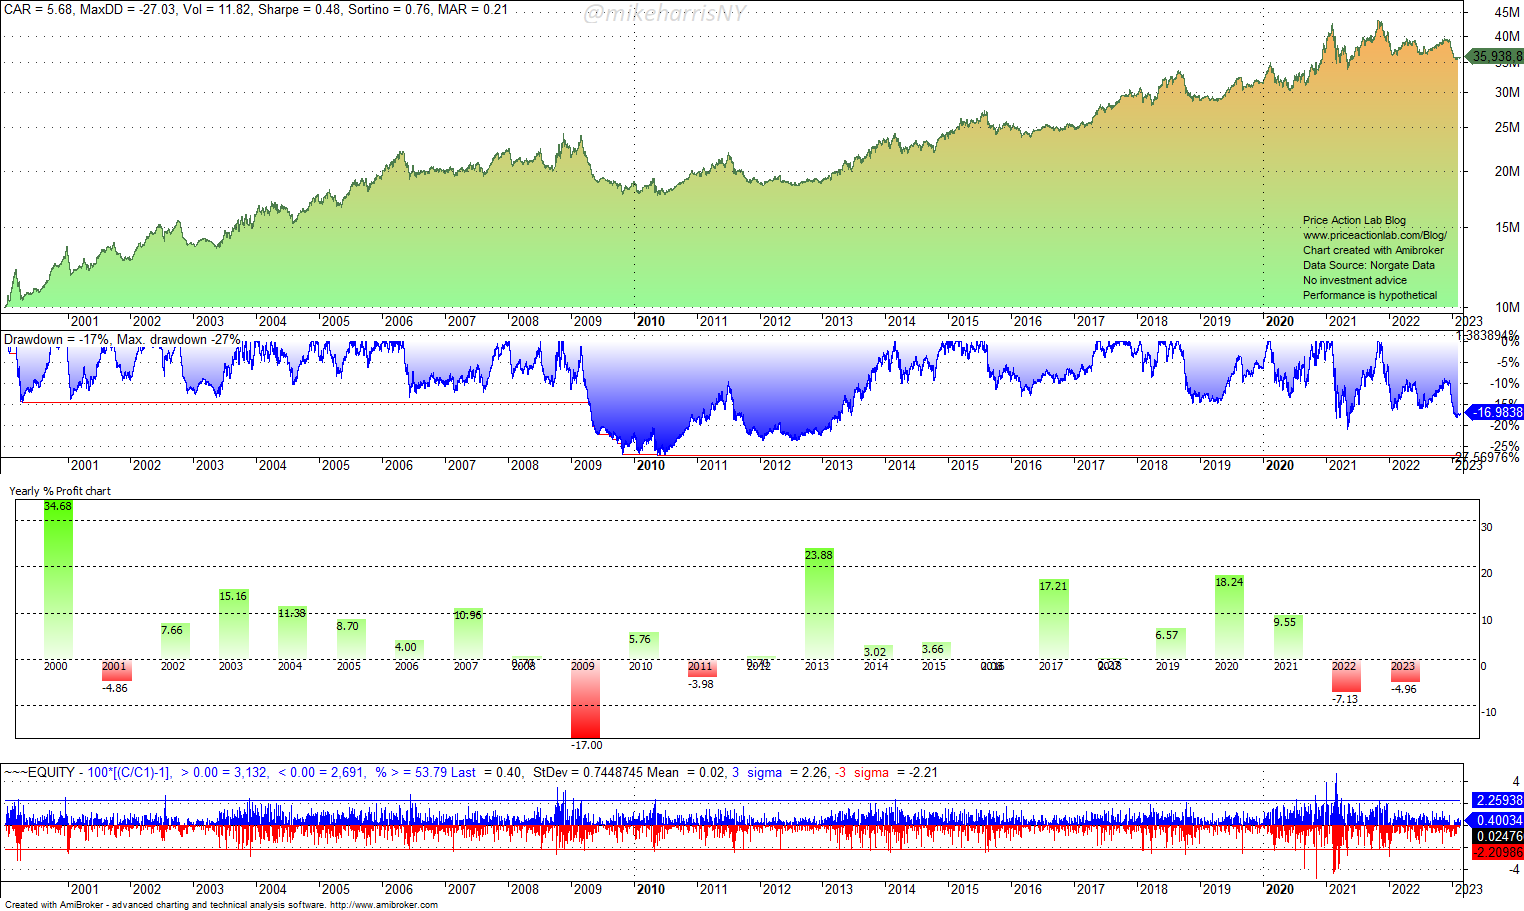
The annualized return is 5.7% with a 27% maximum drawdown. There is a lot of room for improvement, but this is not the subject of this article.
Next, we repeat the backtest, but with the bottom stocks, long and short.
Case 2. Breakouts 50 to 350 days, in increments of 50, Bottom 150 stocks
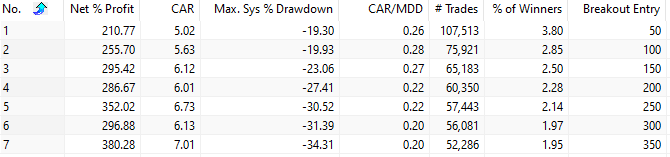
The annualized return varies from 5.02% for 50-day breakouts to 7.01% for 350-day breakouts. The win rate is again very small due to the low stop-loss but the objective is to take many small losses and catch large outliers. Below is the equity curve for 200-day breakout and bottom stocks, long or short.
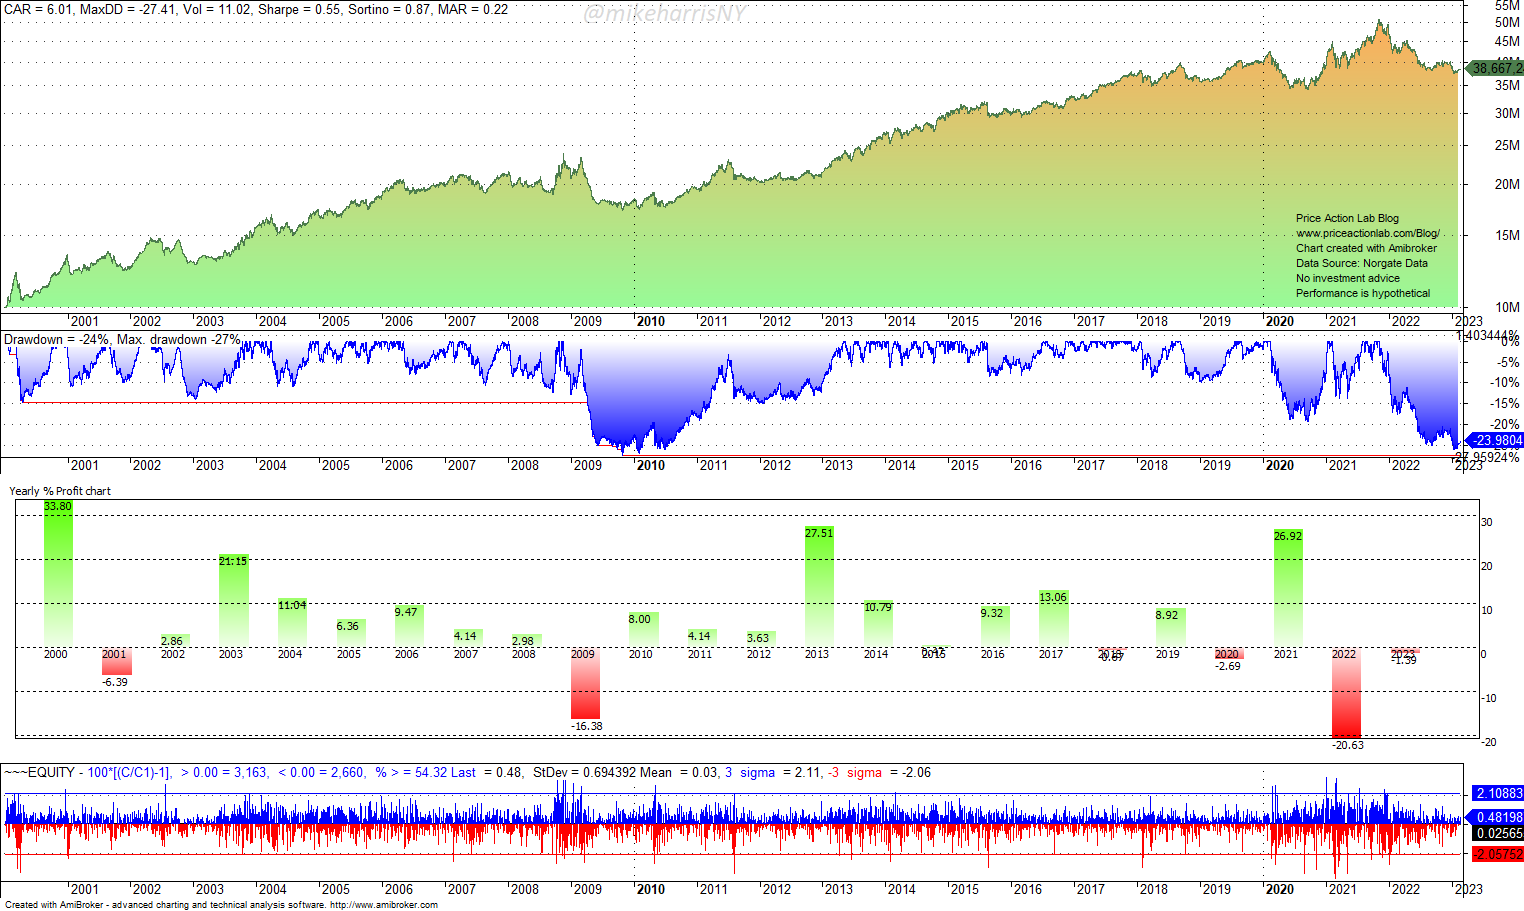
The annualized return is 6% with a 27.4% maximum drawdown. The performance for last year is worst when compared to Case 1. Overall, selecting the bottom performers in the lookback period seems to improve the MAR (CAR/MAX DD) slightly over the backtest period. However, during bear markets, as in 2022, the results may be worse.
Next, we consider the moving average cross as the signal. The fast-moving average is the price and the slow varies from 50 to 300, in increments of 50.
Case 3. Slow moving average 50 to 300 days, in increments of 50, Top 150 stocks
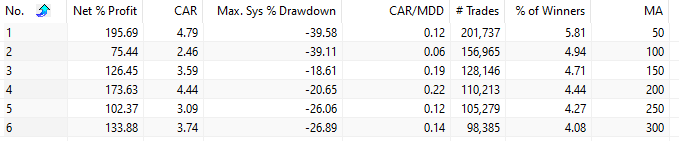
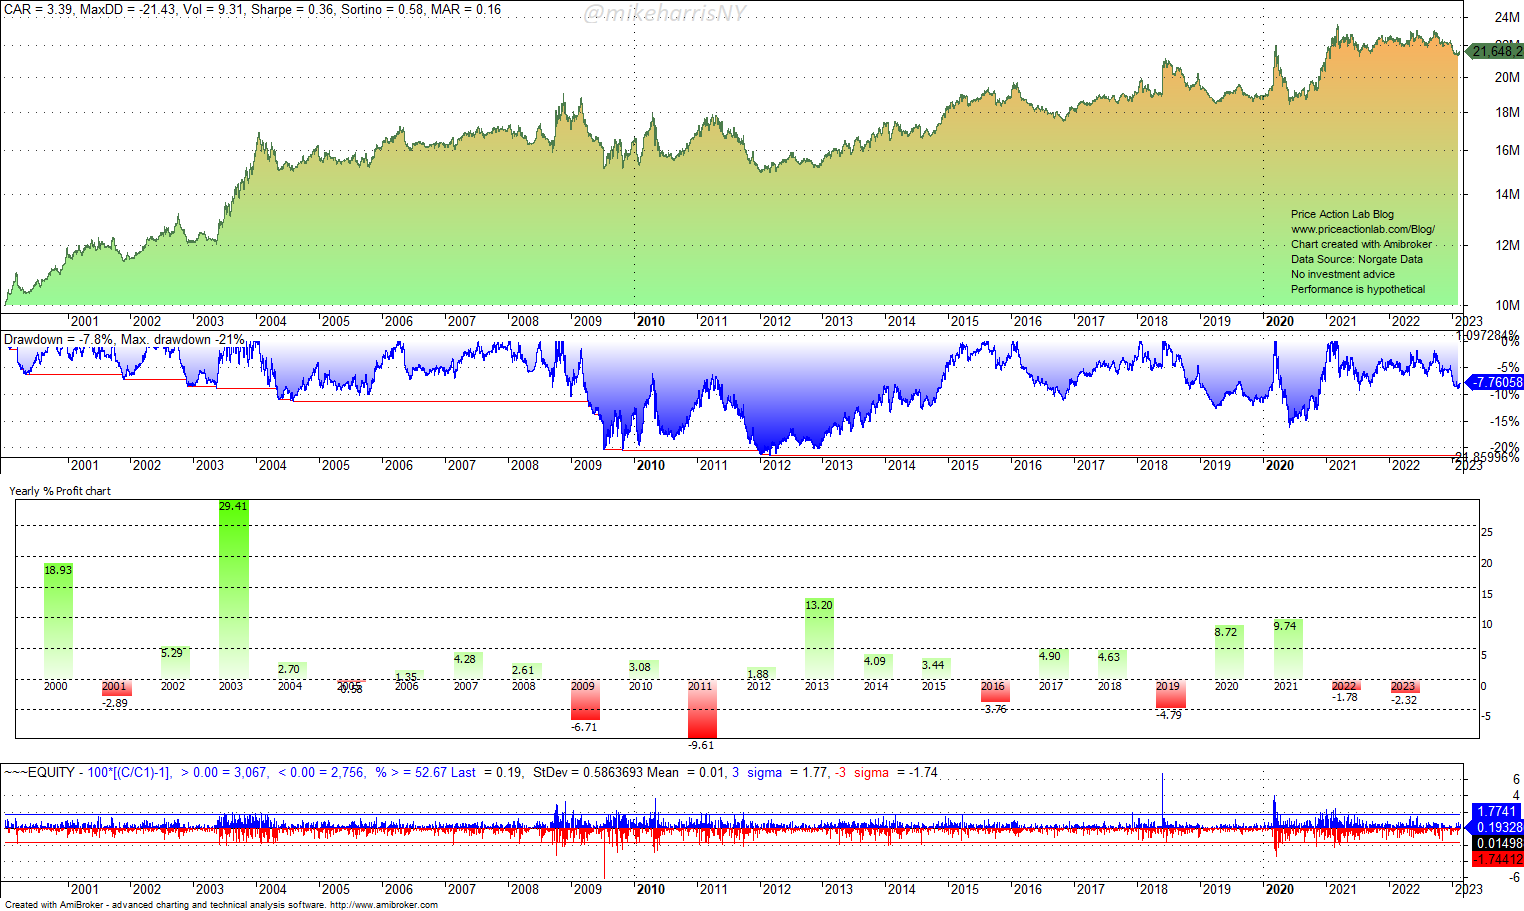
The annualized return varies from 2.46% for 100-day breakouts to 4.79% for 50-day breakouts. The win rate is higher than that of the breakout strategy, and the objective here is to take many small losses and catch large outliers. Below is the equity curve for the 200-day moving average and top stocks, long and short.
The annualized return and the maximum drawdown are lower as compared to Case 1, and last year and also in 2008 there were profits. This strategy appears to offer better convexity, as compared to breakouts.
Next, we repeat the backtest, but with the bottom stocks, long or short.
Case 4. Slow moving average 50 to 300 days, in increments of 50, Bottom 150 stocks
Selecting the bottom stocks does not appear to offer any advantages, and the drawdowns are overall higher. Below is the equity curve for 200-day moving average and bottom stocks, long and short.
Comments
Like most studies with backtests, the one in this article had limited scope and generalizations are difficult to make. However, it appears that when looking for absolute returns, using breakouts with top-ranked stocks may offer an advantage, but when looking for convexity in bear markets, moving averages may work better. There are trade-offs, and there are also some issues related to the use of breakouts with adjusted data since entry points maybe be skewed, but quantifying the impact could be the subject of another article.
Another observation is the low win rates when trading many stocks and the risk per position must be kept low. The strategy takes many small losses and aims to catch those outliers that generate profits. The number of consecutive losers can get above 100, but the losses are small. This strategy is hard to execute because it requires a high level of discipline. For example, for 50 stocks, the risk per position can be increased to 2%, and the number of consecutive losers can be cut in half. However, the performance deteriorates and the maximum drawdown becomes comparable to that of buying and holding.
Profitable trend-following has certain trade-offs and one is a low win rate for long-term profitability. Some traders and analysts have claimed to have developed strategies for trading stocks with a high win rate in the order of 40%. This is nearly one order of magnitude higher than what we were able to get from these conservative backtests with delisted series. The high win rate claims may be due to an edge, certain dubious assumptions or selection bias, or typical backtesting and/or risk management errors.
Disclaimer: No part of the analysis in this blog constitutes a trade recommendation. The past performance of any trading system or methodology is not necessarily indicative of future results. Read the full disclaimer here.
Charting and backtesting program: Amibroker. Data provider: Norgate Data
If you found this article interesting, you may follow this blog via RSS or Email, or on Twitter


