


The classic trend-following with breakouts has not worked well with major forex pairs after 2015, although it has offered an exceptionally high skew.
We backtested the classic trend-following strategy involving one entry, one exit, and a stop-loss, with seven major currency pairs. For the backtests, we used Norgate data for the currency pairs. Since the strategy had an average holding period of 78 days in the backtest period, we ignored the impact of the bid/ask spread on the performance and used the opening and closing prices of the daily data. We highly recommend the Norgate data service for backtesting purposes (we do not have a referral arrangement with the company.)

Timeframe: Daily
Markets: AUDUSD, EURUSD, GBPUSD, USDCHF, NZDUSD, USDJPY, USDCAD
Contract size: Standard lot.
Leverage: 50:1 (2% margin)
Initial capital: $10 million
Strategy type: Trend-following based on 150-day breakouts, stop and reverse.
Maximum positions: Seven, a mix of long and short.
Position size calculations: Based on stop-loss (ATR multiples) and maximum risk per position of 1%.
Trade entry: All trades are executed at the open of the next bar.
Backtest range: 01/1/1990 –05/05/2023
Equity Curve, Drawdown Profile, Yearly Returns, and Daily Returns Histogram
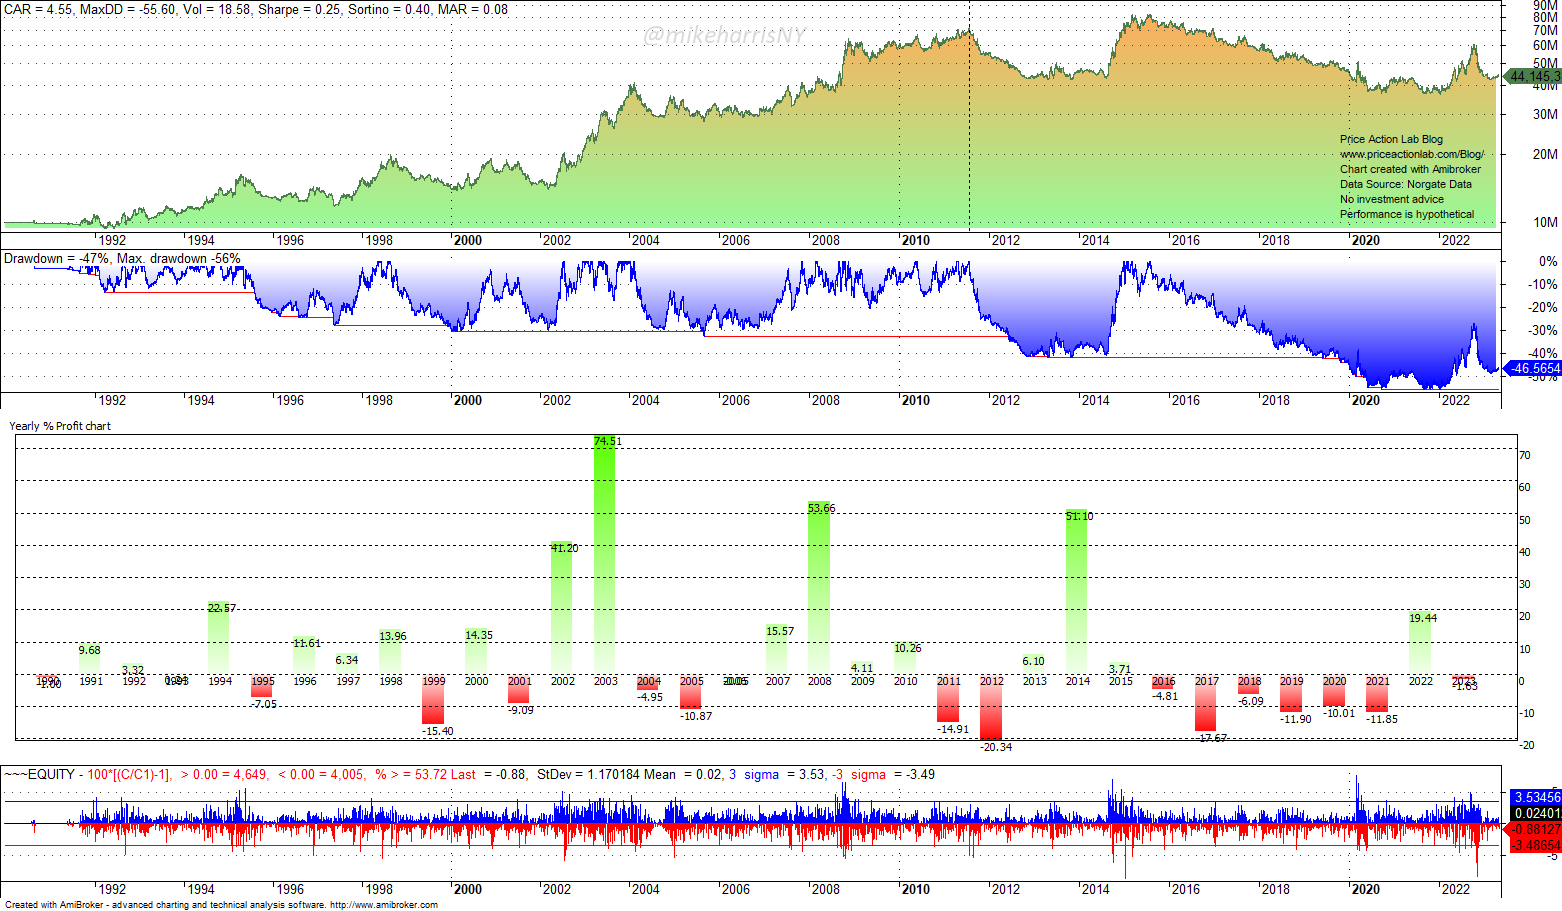
Summary of performance
- The Sharpe ratio is only 0.25.
- The annualized return is 4.6% at 55.6% drawdown.
- The equity volatility is 18.6%.
- After mid-2011, the strategy became unprofitable.
- After 2014, the strategy had a large drawdown of about 57%.
- The strategy has a high skewness of 7.1.
- The win rate is 22% with a total of 522 trades.
Overall, the results were disappointing for the seven major currency pairs, especially after mid-2011. There were six consecutive losing years from 2016 to 2021. In 2003, the strategy was up 74.5% and the largest loss was 20.3% in 2012.
Performance Sensitivity To Changes in Breakout Lookback Period
Below are the results after varying the breakout lookback period from 50 to 350, in increments of 10.
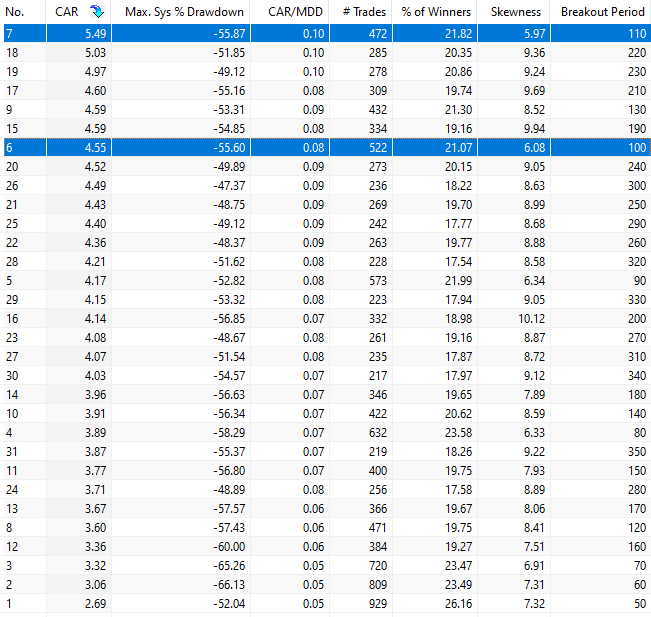
The highest annualized return is 5.49% for 110 days. The performance deteriorates for a period below 100. There is no significant improvement in performance after changes in the lookback period. In other words, trend-following of major currency pairs with breakouts, one entry, one exit, and stop-loss, has certain performance limitations. The limitations may be structural because of the particular markets.
A brief note about high values of skewness
As may be seen from the above table, even for low values of the breakout period the skewness of the distribution of the trades remains high. Skewness alone is not a useful metric. Strategies with long periods of low performance may have high skewness because of a small set of outlier trades. The skewness must be evaluated in the context of the overall distribution, and the mean, standard deviation, and kurtosis must be also considered. There is a tendency in financial media to refer to higher skewness as preferable for trend-following strategies, but strategies with low values can be more robust depending on the distribution of returns.
Conclusion
Simple breakouts, with one entry, one exit, and a stop-loss have not performed well with the seven major currency pairs considered in this study. We believe that the reason is due to the dynamics of the forex markets, and overall, including these markets in trend-following may adversely affect performance in the long term. However, the study was limited to the seven major pairs. Including more pairs, also the ones known as exotic, may improve returns, but this may be the subject of another article.
Disclaimer: No part of the analysis in this blog constitutes a trade recommendation. The past performance of any trading system or methodology is not necessarily indicative of future results. Read the full disclaimer here.
Charting and backtesting program: Amibroker. Data provider: Norgate Data
If you found this article interesting, you may follow this blog via RSS or Email, or on Twitter


