


A positive skew of strategies does not guarantee anything, and it can even be undesirable under specific market regimes.
As I have written before, marketing has taken a few statistical notions and mixed them into narratives in support of certain financial products and strategies. In general, it is hard to differentiate where sound analysis ends and marketing starts.
Positive skew has been in the financial news since Commodity Trading Advisors (CTAs) recovered from a lost decade due to a surge in inflation triggered by the pandemic helicopter money policy and a supply shock.
Skew is the third moment of a statistical distribution. The first two moments are the mean and the variance. The fourth moment is kurtosis, another misunderstood and abused statistical property.
A positive skew tells us that the distribution of the returns of a strategy has a longer right tail due to outliers. For example, the income distribution has a positive skew because most people are around the average and a few people have high incomes, for example, CEOs of Fortune 500 companies.
In the same way that a high positive skew in income distribution may indicate an unstable economic system due to high inequality, a positive skew in a trading strategy could be a reflection of internal weakness instead of strength. This is because the strategy is looking for outliers, and when few or none are present, it can have long underperformance periods. This is what happened to CTAs between 2009 and 2018, also known as the Lost Decade. Below is a chart of the SG CTA index with yearly returns, a drawdown profile, and statistics.
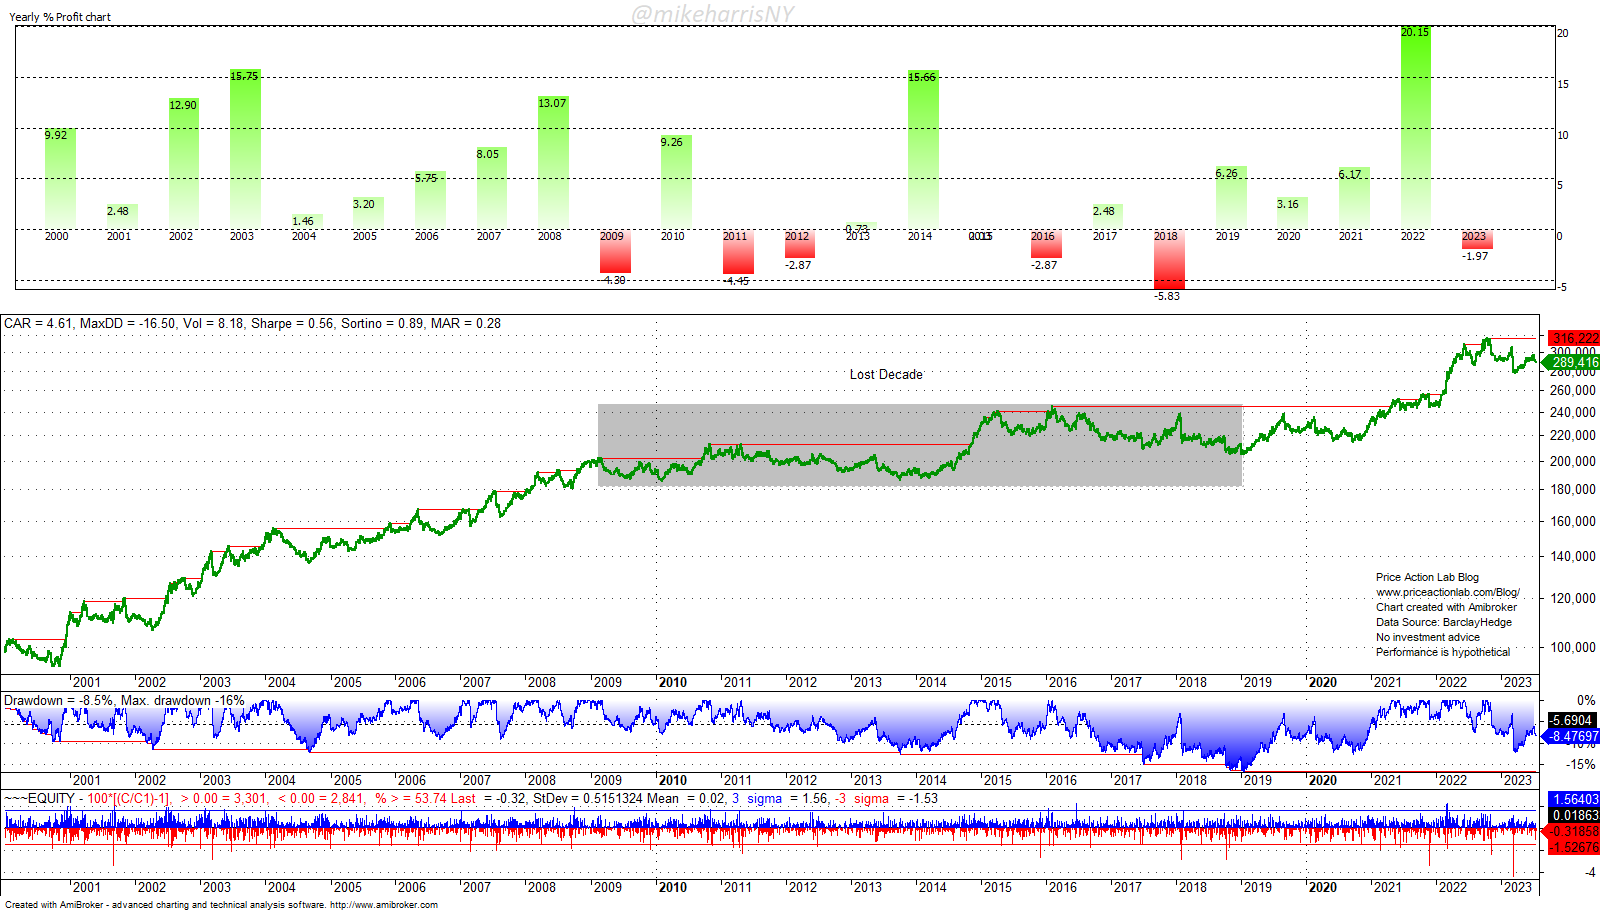
The gray area marks a lost decade of CTAs from 2009 to the end of 2018. Despite a “high skew” from past performance, for 10 years, CTAs delivered no profits. One reason for the deterioration of performance was a lack of outliers in the quantities required to turn positive skew into gains.
Last year, CTAs had their best performance on average since 2000 due to a rise in inflation and robust trends in the markets. The performance may be a random outlier, as these conditions may not repeat in the foreseeable future. However, there is intense talk about positive skew and even efforts to undermine the Sharpe ratio because, for CTAs on average, it is low.
The Sharpe ratio is one of the most important quantitative measure of the robustness of strategies because it provides an indication about the duration and depth of drawdowns, but the details are beyond the scope of this brief article.
The effort to undermine the Sharpe ratio and focus on positive skew is, in my opinion, due to marketing. Strategies can have a high positive skew and still fail. A positive skew is not some special property of CTA strategies; it is the result of the application of stop-loss that causes many small losing trades (like many people with small wages) and a few large winning trades (like a few people with high wages), but at the expense of a lower win rate and often a lower Sharpe ratio.
Let us look at an example below: We will consider the PSI5 mean-reversion strategy in SPY that does not use stop-loss and then apply a small stop of 1% to all trades. Then, we will compare to the performance of the SG CTA index. The backtest period is from March 1, 2000, to July 20, 2023.
| PSI5 No Stop-loss | PSI5 with 1% Stop-loss | SG CTA Index | |
| CAGR | 9.8% | 5.0% | 4.6% |
| MAX. DD | -22.6% | -25.9% | -16.5% |
| VOLATILITY | 15.1% | 11.1% | 8.2% |
| SHARPE | 0.65 | 0.45 | 0.56 |
| TRADES | 883 | 965 | – |
| WIN RATE | 68% | 61% | – |
| SKEW | -1.43 | +0.41 | -0.50* |
* Skew of weekly returns.
We took a mean-reversion strategy with a high negative skew, applied a tight stop, and ended up with a strategy with a much lower annualized return but also a slightly lower volatility, and more importantly, a positive skew. At the same time, the skew of the SG CTA index based on weekly returns is negative. The drawdown is much lower because this is an ensemble of several strategies.
Summary
“Skew” sounds mysterious to laymen, and marketing has abducted the term and is using it in narratives. The skew is just one statistical parameter, and its value is no guarantee of performance; it must be evaluated together with other parameters and also analyzed to determine whether a positive skew is compatible with current market regimes. If there are no sufficient outliers, then positive skew strategies could end up in the red or even cause an uncle point. At the same time, in such regimes, mean-reversion strategies usually do well but at higher risks.
Premium Content
By subscribing you have immediate access to hundreds of articles. Premium Articles subscribers have immediate access to more than two hundred articles and All in One subscribers have access to all premium articles, books, premium insights, and market signals content.
Free Book
Subscribe for free notifications of new posts and updates from the Price Action Lab Blog and receive a PDF of the book “Profitability and Systematic Trading” (Wiley, 2008) free of charge.
Disclaimer: No part of the analysis in this blog constitutes a trade recommendation. The past performance of any trading system or methodology is not necessarily indicative of future results. Read the full disclaimer here.
Charting and backtesting program: Amibroker. Data provider: Norgate Data
If you found this article interesting, you may follow this blog via RSS, Email, or Twitter.


