


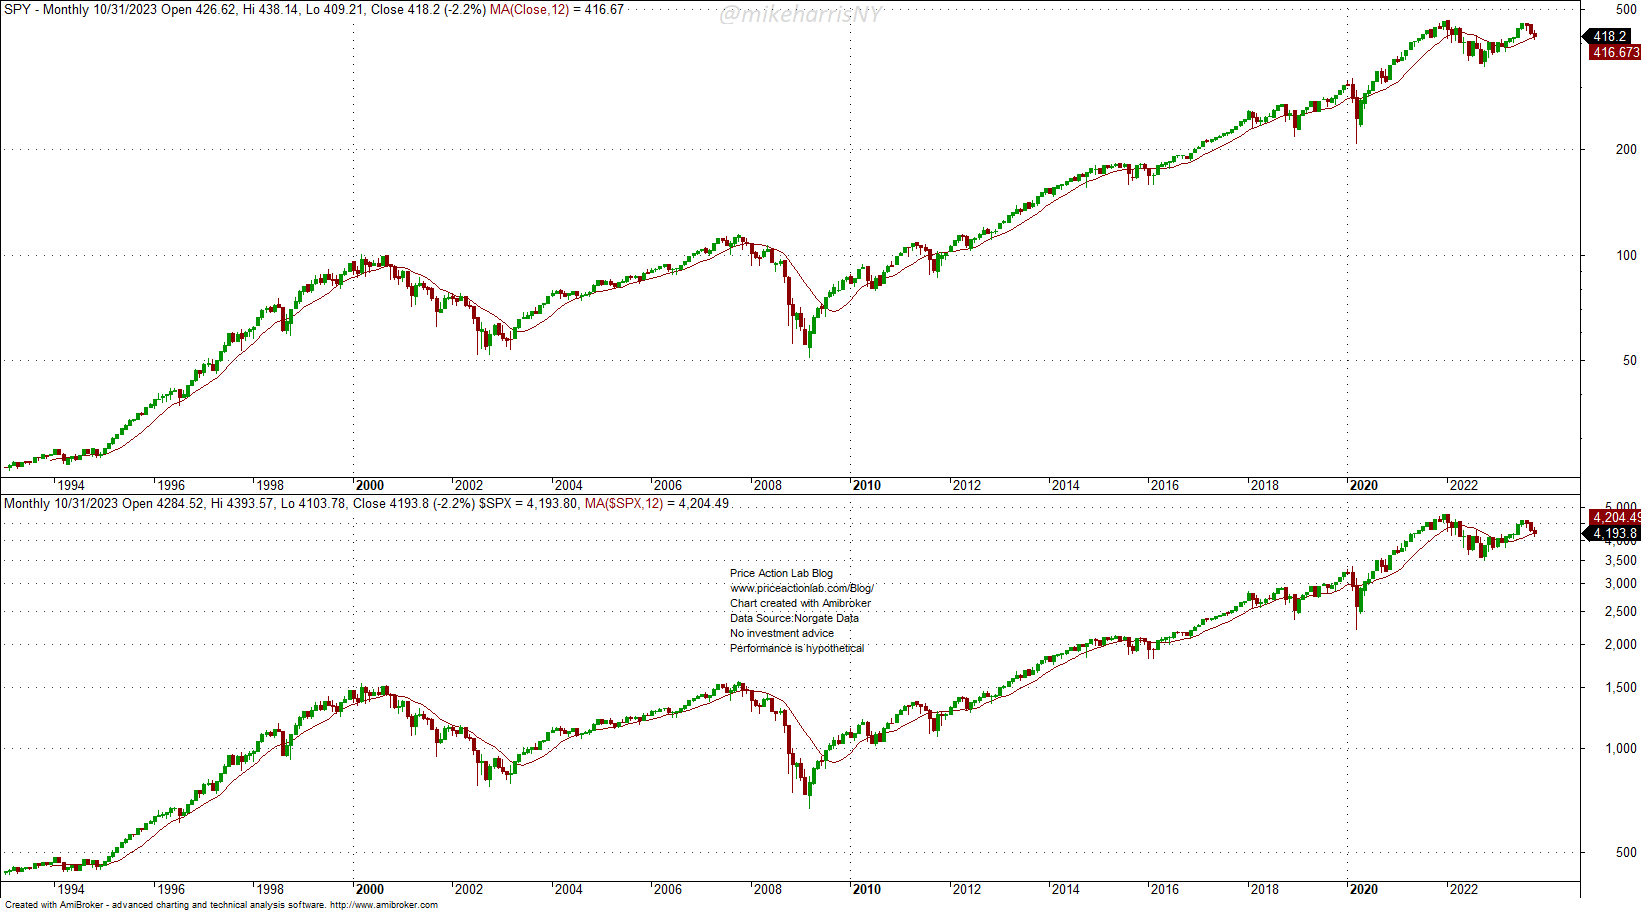
On October 31, 2023, the S&P 500 closed below its 12-month moving average, but the SPY ETF closed above its 12-month moving average. Which is better to use for momentum signals? The ETF or the index?
This is the monthly chart that shows the levels of SPY (top) and S&P 500 (bottom) and the 12-month moving averages as of the close of October 31, 2023.
We have a problem here, and it is the usual one with market analysis: small samples. We have data for the S&P 500 index going back officially to 1960, and with extrapolation, many decades or even a few centuries, but the SPY ETF data start on January 29, 1993 We could use other funds that track the S&P 500, but the sample size will not change much.
What is the sample size of divergences between the signals using the S&P 500 and SPY ETF for exiting the markets, i.e., after the price crosses below the 12-month moving average? The answer is provided below, along with the backtests and our analysis.
|
This post is for paid subscribers
Already a subscriber? Sign in |
Access the full report with a Premium Articles or All-in-One subscription.
By subscribing, you have immediate access to hundreds of articles. Premium Articles subscribers have immediate access to more than two hundred articles, and All in One subscribers have access to all premium articles, books, premium insights, and market signal content.
Specific disclaimer: This report includes charts that may reference price levels determined by technical and/or quantitative analysis. No charts will be updated if market conditions change the price levels and/or any analysis based on them. All charts in this report are for informational purposes only. See the disclaimer for more information.
Disclaimer: No part of the analysis in this blog constitutes a trade recommendation. The past performance of any trading system or methodology is not necessarily indicative of future results. Read the full disclaimer here.
Charting and backtesting program: Amibroker. Data provider: Norgate Data
If you found this article interesting, you may follow this blog via RSS, Email, or Twitter.


