


Construction, mainly residential, was the main driver of the recovery from the pandemic. The new driver is large language models and the promise of a transition to artificial general intelligence and accelerated growth.
How much of this is a narrative during an election year, and how much is reality, is a difficult question to answer. Traders and investors should stay with the facts. It may take a long time for reality to deconstruct narratives. Here, we deal with the facts.
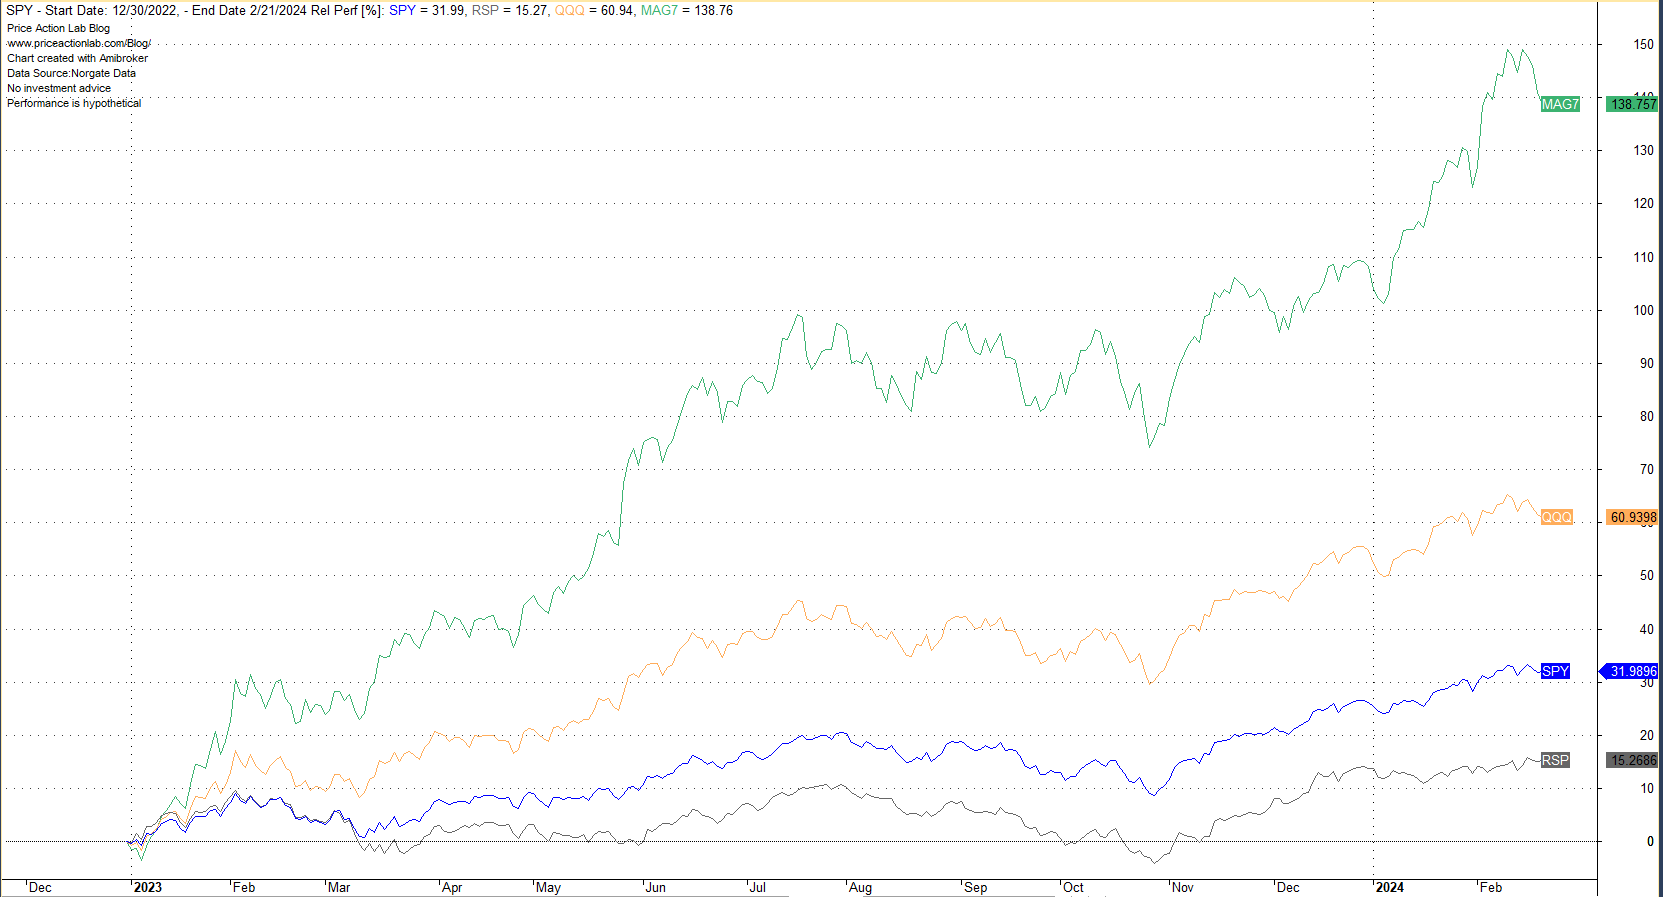
Since January 3, 2023, the magnificent 7 are up nearly 140% on an equal-weight basis. The QQQ ETF has been up about 61%, while the SPY ETF has only gained 32%. The broader large-cap market has gained just 15.3%. You do not have to be a rocket scientist to realize what is going on.
A fundamental regime change has occurred in the US economy. Construction, both residential and commercial, has been the main economic driver for many decades. But after the pandemic, construction peaked, real estate prices exploded, and commercial real estate was hit hard due to technological advancements that facilitate “work from home.” Is this a permanent regime change? Although no one can say for sure, it could be. Again, we are concerned only with the facts and the data.
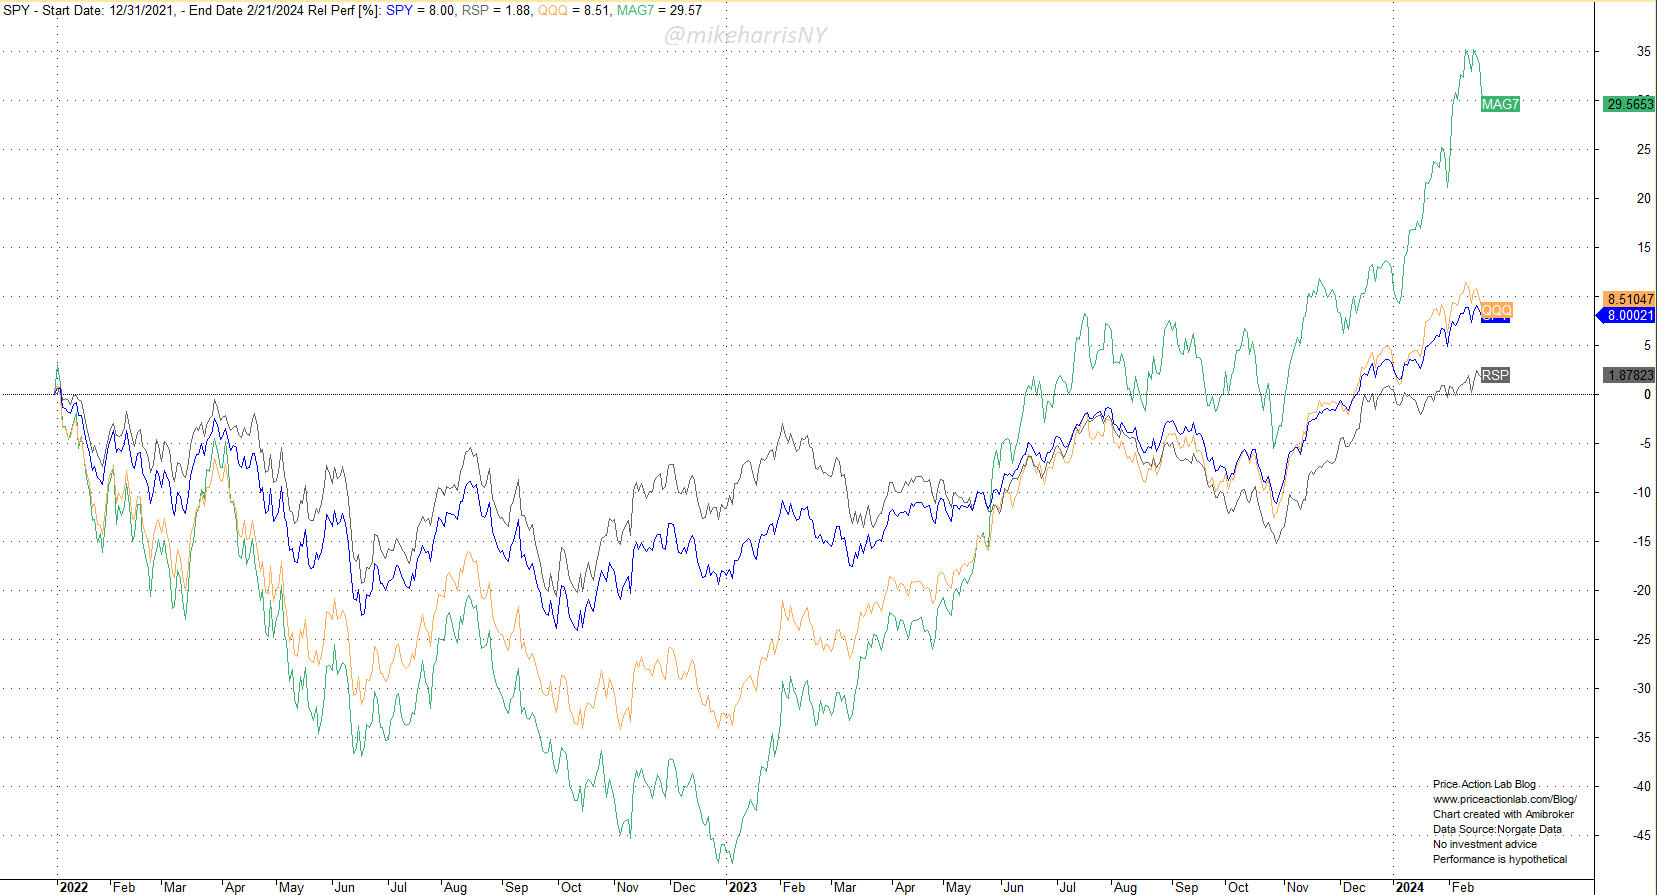
During the peak of the 2022 correction, the magnificent 7 stocks were the hardest hit. The drawdown on an equal-weight basis was reminiscent of the drawdowns reached during dot-com and financial crisis meltdowns, around 50%. At the same time, the broader market was still holding relatively well, with the equal-weight S&P 500 ETF (RSP) down about 10%.
Then, the narrative about AI and LLMs intensified. Investors switched to mega-caps that promised large gains due to investments in AI. Last year, the Magnificent 7 recovered quickly, and since 2022, they are up nearly 20%, while the broader market (RSP) is barely in the black.
Is the AI narrative and the associated market moves sustainable?
No one can say for sure, but historically, bubbles burst. Bubbles can persist for longer than shorts can remain solvent. In addition, most investors attempt to chase prices during the last stages of a bubble market. At this point, there are many skeptics, and this is bullish for the market. However, things can reverse quickly.
Even if this bubble bursts and AI does not deliver on its promises, something good will come out of it, as was the case with the dot-com bubble. The dot-com bubble came after a regime with similar conditions: a commercial real estate crisis in the 1990s and the promise of the “information highway” changing the world.
The internet changed the world, but many companies from the dot-com period went bankrupt. I expect a similar outcome from this AI frenzy: the good and useful technology will survive, and the less useful will not.
The realization that it is impossible to predict when the bubble will burst may offer some comfort. Low-complexity indicators and strategies can limit any losses and provide some protection when the bubble burst process starts. This is what we try to do on this blog.
Premium Content
Market analysis based on 30 years of skin-in-the-game
By subscribing, you have immediate access to hundreds of articles. Premium Articles subscribers have immediate access to more than two hundred articles, and All in One subscribers have access to all premium articles, books, premium insights, and market signal content.
Specific disclaimer: This report includes charts that may reference price levels determined by technical and/or quantitative analysis. No charts will be updated if market conditions change the price levels or any analysis based on them. All charts in this report are for informational purposes only. See the disclaimer for more information.
Disclaimer: No part of the analysis in this blog constitutes a trade recommendation. The past performance of any trading system or methodology is not necessarily indicative of future results. Read the full disclaimer here.
Charting and backtesting program: Amibroker. Data provider: Norgate Data
If you found this article interesting, you may follow this blog via RSS, Email, or Twitter.


