


The introduction of a delay in the entry of a position after a price pattern is formed can under certain circumstances act as a filter of price corrections that often follow. In the absence of a delay, positions may suffer an immediate correction and the corresponding price patterns may generate more losers than winners due to profit taking. The delay can allow time for prices to recover before a position is established and thus contribute to a higher profitability for a trading system.
Note that the use of delay filters does not come without problems. One must be very careful due to curve-fitting issues. For example, in a strongly up-trending market, a delay in the establishment of long positions in conjunction with the proper target/stop values can result in random patterns and vice versa in down-trending markets.
The search function of Price Action Lab program determines the best value of the delay for the price patterns it discovers based on the range of values specified by the user. With the delay option activated, it is often the case that the program finds more patterns that satisfy the performance criteria set in the search workspace.
An Example
In this example of machine generation of trading systems, the steps are presented for discovering price patterns to develop a position trading system for GBPUSD spot currency first without delay and then with a delay. The patterns are discovered using the Price Action Lab search function in an in-sample of daily historical data. The in-sample results are then tested in an out-of-sample. It is shown that Price Action Lab can identify more patterns with a delayed entry in a deterministic (reproducible) way that result in a statistically significant and profitable system in the out-of-sample period.
The GBPUSD currency pair was selected because in its price history it exhibits major up and down swings and long periods of sideways movement, as it may be seen from the daily chart below from 01/04/1999 to 11/16/2012:
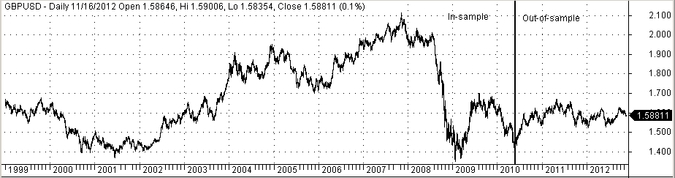
Actually, the out-of-sample involves only a short duration uptrend and for the remaining time of about two years the market moves in a tight range. This type of out-of-sample is very challenging and provides a good test of the significance of the in-sample patterns. However, it should not be expected that the performance in the out-of-sample matches or even exceeds that of the in-sample. Such requirement would be totally unrealistic because of the tight range and volatility in the out-of-sample, as well as, of its short duration in relation to the in-sample.
The results presented here, except the pattern code, can be confirmed by anyone with a demo version of Price Action Lab. Actually, the demo version was used to generate most of the results of this study.
Step 1: Create a target and stop file
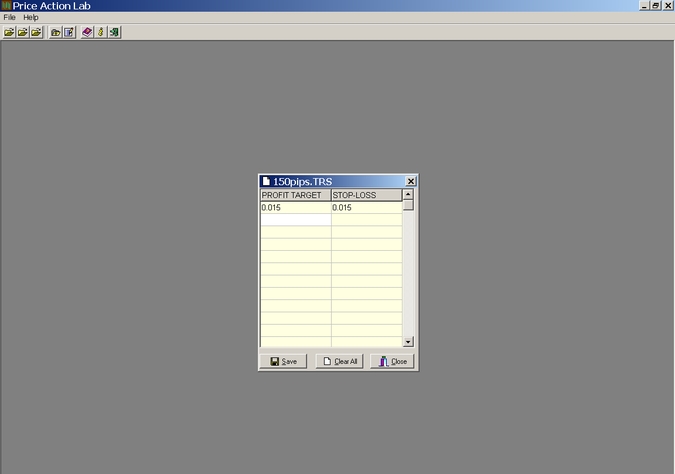
The proper value to be used that corresponds to 150 pips is 0.015.
Step 2: Create a search workspace
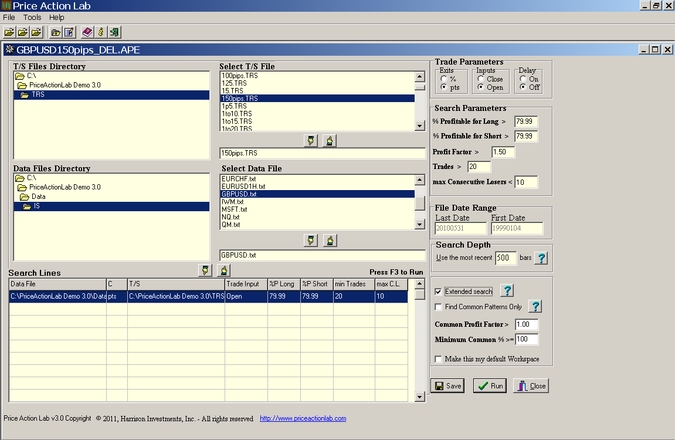
The workspace is created by selecting the following:
a) The T/S file we created by the name 150pips.trs
b) The in-sample data file GBPUSD.txt. Range: 01/04/1999 – 05/31/2010.
c) The trade parameters: ”pts” is is marked to indicate that the values in the selected T/S file stand for points added to the entry price, which is selected as the open of the next bar under Inputs. The Delay input is kept marked off. (Using delay inputs will be the subject of another post).
d) Under search parameters we input 79.99 for the percent minimum win rate for both long and short patterns. The other parameters stay at default values.
e) The date range in the data file is shown under File Date Range. In this case it corresponds to the in-sample range. The Search Range is left to 500. This means that Price Action Lab will demand that all patterns that are found to satisfy the performance criteria set in (a) – (d) must have at least one historical trade in the most recent 500 bars. Finally, the Extended search option is checked and we run the workspace.
Case 1: Patterns with no delay
Step 3: In-sample results
Price Action Lab will run for an interval of time depending on computer CPU speed but in this particular case it will complete the search after about 30 minutes on the average. The output should look like the one below:
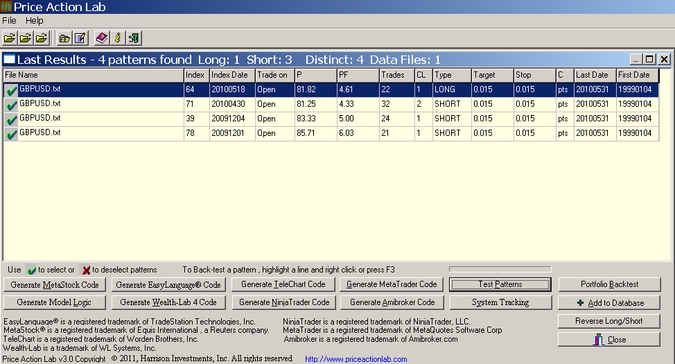
Each line in the above results corresponds to a price pattern that satisfies the performance parameters specified by the user. Index and Index Date are used internally to classify patterns. Trade on is the entry point, in this case the Open of next bar. P is the success rate of the pattern, PF is the profit factor, Trades is the number of historical trades, CL is the maximum number of consecutive losers, Type is LONG for long patterns and SHORT for short patterns , Target is the profit target, Stop is the stop-loss and C indicates whether % or points for the exits, in this case it is “pts”. Last Date and First Date are the last and first date in the historical data file.
It may be seen from the results that Price Action Lab found 4 patterns, 1 long and 3 short, which satisfied the performance criteria specified on the workspace for the in-sample. (Keep in mind that this is only one example for specific risk/reward criteria and performance parameters). One could argue that these patterns are random and a result of survivorship bias, i.e. they survived by chance alone and they have no predictive power. This is the reason we used an in-sample to search for the patterns and we will now use the out-of-sample to see how these patterns performed in a regular backtest. Please note that:
– Price Action Lab does not look at the out-of-sample when searching the in-sample. This is very important because if a program looks at the out-of-sample and then selects patterns from the in-sample that also worked well in the out-of-sample this is an extremely bad (and even deceiving) practice that is known as data-snooping.
– Price Action Lab does not find systems that later allow varying their parameters for fitting their performance in the out-of-sample. All patterns found are parameter-free, eliminating an important but serious concern dealing with curve-fitting.
– Price Action Lab does not use genetic programming, neural networks, permutations or any other methods employed by some other programs that produce random and curve-fitted systems. Price Action Lab is based on a proprietary deterministic algorithm that produces the same output each time it encounters the same conditions and that is in compliance with the standards of scientific testing and analysis.
Step 4: Out-of-sample testing
With Price Action Lab it is easy to test in the out-of-sample all patterns found in the in-sample results. Just click on Test Patterns and then select the location of the out-of-sample data file, as shown below:
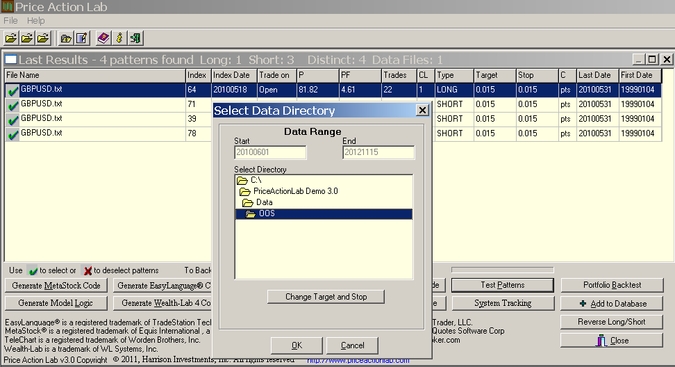
It may be seen that the out-of-sample period is from 06/01/2010 to 11/15/2012. The results are obtained shortly after making the selection and confirming it:
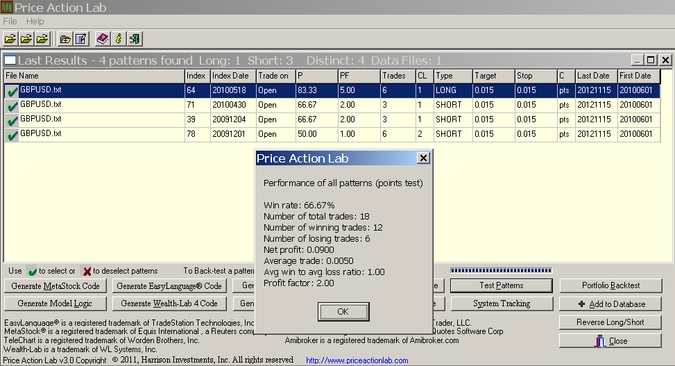
For a backtest allowing multiple signals (all the pattern signals), in the out-of-sample period the win rate was 66.67% and the profit factor was 2.00 on a total of 18 trades. A net profit of 900 pips was generated before commissions and slippage.
Case 2: Patterns with delay
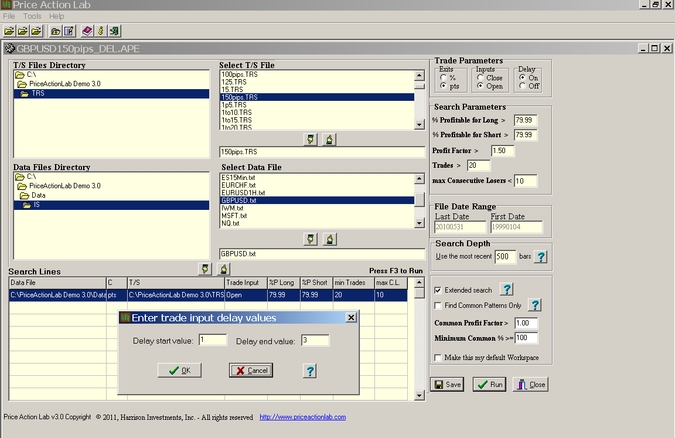
Step 5: Create a search workspace
The workspace settings are the same as in Step 2 above but in this case a delay range of 1 to 3 bars is specified using the Delay option in Trade Parameters:
Step 6: In-sample results
Price Action Lab will run for an interval of time depending on computer CPU speed but in this particular case it will complete the search after about 2 hours on the average. The output should look like the one below:
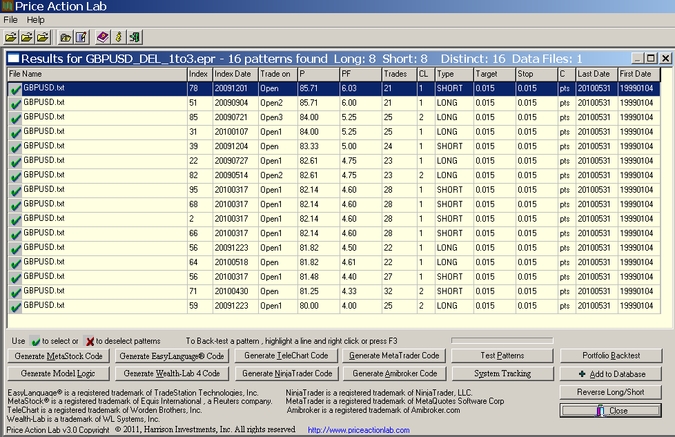
In this case 16 patterns were found that satisfied the performance criteria specified on the workspace for the in-sample. (Keep in mind that this is only one example for specific risk/reward criteria and performance parameters). The results show long/short pattern symmetry with 8 long and 8 short patterns. This is important since it shows that the price series and the search algorithm give the same weight to long and short patterns and the results are not biased towards one direction.
Step 7: Out-of-sample testing
The out-of-sample period is from 06/01/2010 to 11/15/2012. The results are obtained shortly after making the out-of-sample data file selection using the Test Patterns tool:
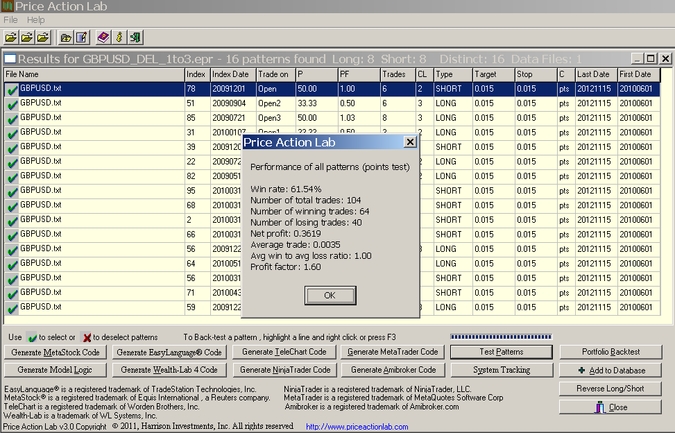
It may be seen that for a backtest allowing multiple signals, in the out-of-sample period the win rate was 61.54% and the profit factor was 1.60 on a total of 40 trades. A net profit of 3,619 pips was generated before commissions and slippage.
Step 8: Code generation
Code for the patterns cna be generated for Tradestation and other popular platforms for implementing, testing and trading a system.
Step 9: Add the systems to system tracking or generate code
The patterns Price Action Lab discovered can be added to the system tracking module of the program for receiving notifications when a signal is generated or, if the user wishes, code can be generated for implementing a system in some other popular platform.
Comments and FAQ
How long will these patterns remain profitable? This is unknown. However, the real value of Price Action Lab is that the search can be repeated again after six months to a year, for example, and the systems can be upgraded. This is not like buying a black-box and having to live with it.
Do I really need the out-of-sample test since it reduces available data for the in-sample? Actually, some people believe that out-of-sample testing is not needed after it is used to confirm that a certain process of finding trading systems leads to significant results. Thus, if it is shown than Price Action Lab can get significant patterns in an out-of-sample as long as the one in this post, then the process can be eliminated all together and the available data can be used as an in-sample to increase search flexibility. Instead of doing out-of-sample tests, the search is rerun every six months and the system is rebalanced. However, as expected, opinion vary on this and some prefer to develop systems based on an in-sample followed by cross-validation on an out-of-sample while other use the whole price series for the in-sample and then test the resulting system forward on paper. These two approached both have advantages and disadvantages.
Disclosure: no relevant position at the time of this post.
Charting program: Amibroker (Charts created with AmiBroker – advanced charting and technical analysis software. http://www.amibroker.com/”)


