


I have talked about the significant variations between unadjusted and dividend adjusted stock charts, as well as between continuous and adjusted futures charts, and how they can lead to very different inferences in the context of classical technical analysis. This empirical fact adds to the high ambiguity surrounding classical chart analysis and raises some important issues regarding its reliability and credibility. Here is the latest conflict in SPY.
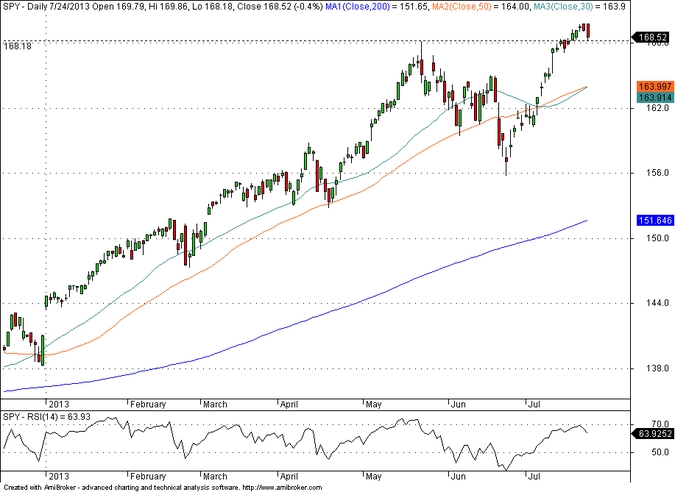
According to the dividend adjusted chart of SPY, the market found support at the adjusted high of May 22 at $168.18 and closed above it:
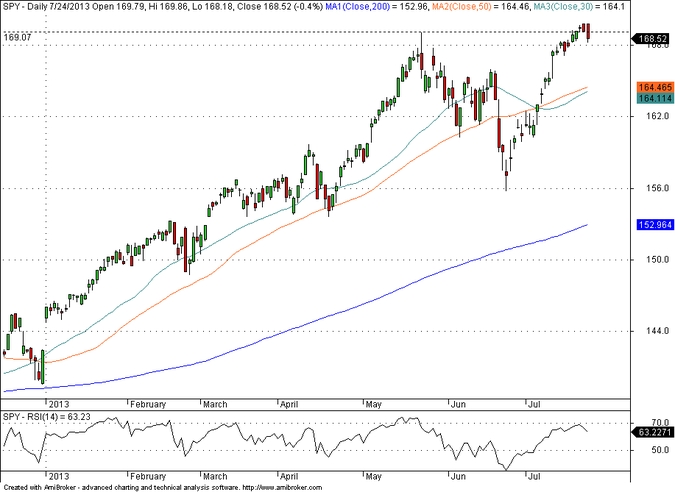
But according to the unadjusted chart, the market closed below the May 22 high:
Which chart to believe: On one hand, the accuracy by which support was tested on the adjusted chart is stunning and this means that many follow adjusted charts (especially when free chart services in the web use them). On the other hand, past adjusted prices are not realistic and reflect hypothetical levels, i.e. levels at which traders at that time would not have acted.
This is a problem both for stock traders but also more important for futures traders who often see mirages on charts because of frequent rollovers and data adjustments and think they are some kind of technical analysis patterns. Actually, I know of a guy who got ruined by his ignorance of these effects.
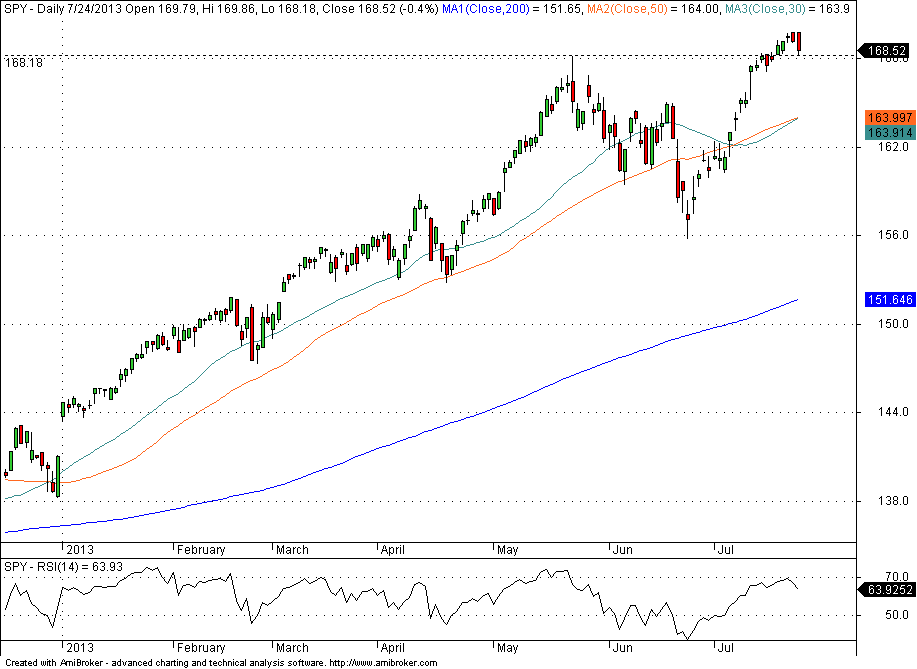
I have shown a gif animation in the past to describe an effect that in my opinion causes chaos in technical analysis but it is a taboo subject:
The adjustments also have an impact on backtesting results and many novice and otherwise system developers ignore them. See how the SPY chart is distorted by going from unadjusted to adjusted. I mean…give me a break technical analysts…, at least until you make up your mind: adjusted or unadjusted charts, or both?
Related posts
Disclosure: no relevant positions.
Charting program: Amibroker
Disclaimer


