


Extreme overbought and oversold conditions might be one of the top causes of technical trader failures.
All technical indicators have good and bad aspects. It is often hard for traders to benefit from the good aspects and easy to get ruined by the bad aspects.
I am not a fan of technical analysis. I prefer rule-based strategies and quantitative analysis. However, even quants use aspects of technical analysis they have found useful, and this is unavoidable. In addition, some of the quantitative methods have evolved from technical analysis or can be reduced to it. But the subject of this brief article is to make the point that technical analysis indicators have some good and bad aspects, and it is usually the latter that dominates and causes trader ruin. One of those bad aspects is tail events. Below is the distribution of the number of days the NASDAQ-100 has remained overbought based on an RSI higher than 70.
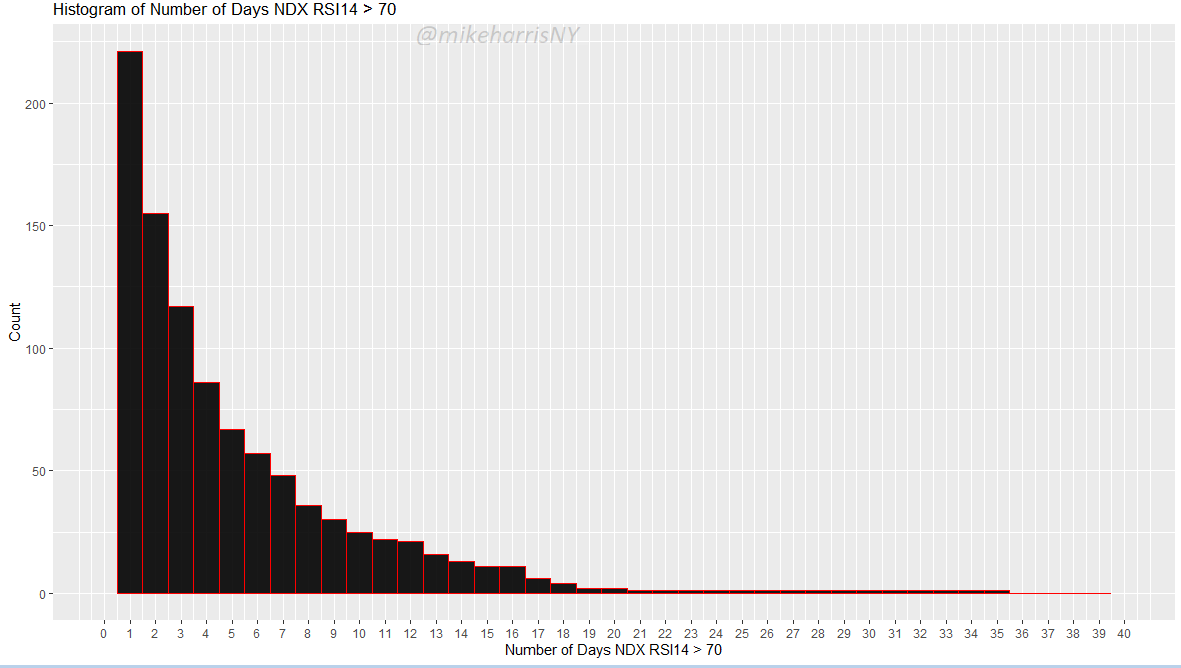
Distribution of the number of days the NASDAQ-100 has remained overbought based on an RSI higher than 70. Daily chart from 01/1985 to 06/2023
The distribution appears exponential, with the maximum number of days the index has remained overbought (RSI 14 > 70) at 35 and a mean of 5.1 days. This distribution has a long tail, which is a little better than one with a fat tail but still reflects the high risks. A similar distribution arises for oversold conditions (RSI 14 < 30), but the tail is not as long (maximum 12 days and mean of 2.6 days). The difference between overbought and oversold tails can be attributed to the long-term upward bias: equity markets stay overbought for longer periods than they stay oversold.
I use the RSI indicator as an example in this article since, in the last few days, many traders have made references to it due to overbought conditions in equity indices. Most traders who use technical analysis probably keep an eye on this indicator because it is relatively simple. As I have written before in this blog, this is a tricky indicator, and interpreting its signals requires careful analysis and context. The reason for that is that the RSI measures relative strength, as the name says, but most technical traders use it to identify overbought and oversold conditions that signal reversals; this use of the RSI is what gives rise to its bad aspect.
A few pictures are better than a thousand words and math. Below is a chart of the QQQ ETF with the number of days the RSI 14 indicator has stayed above 70 plotted as an indicator.
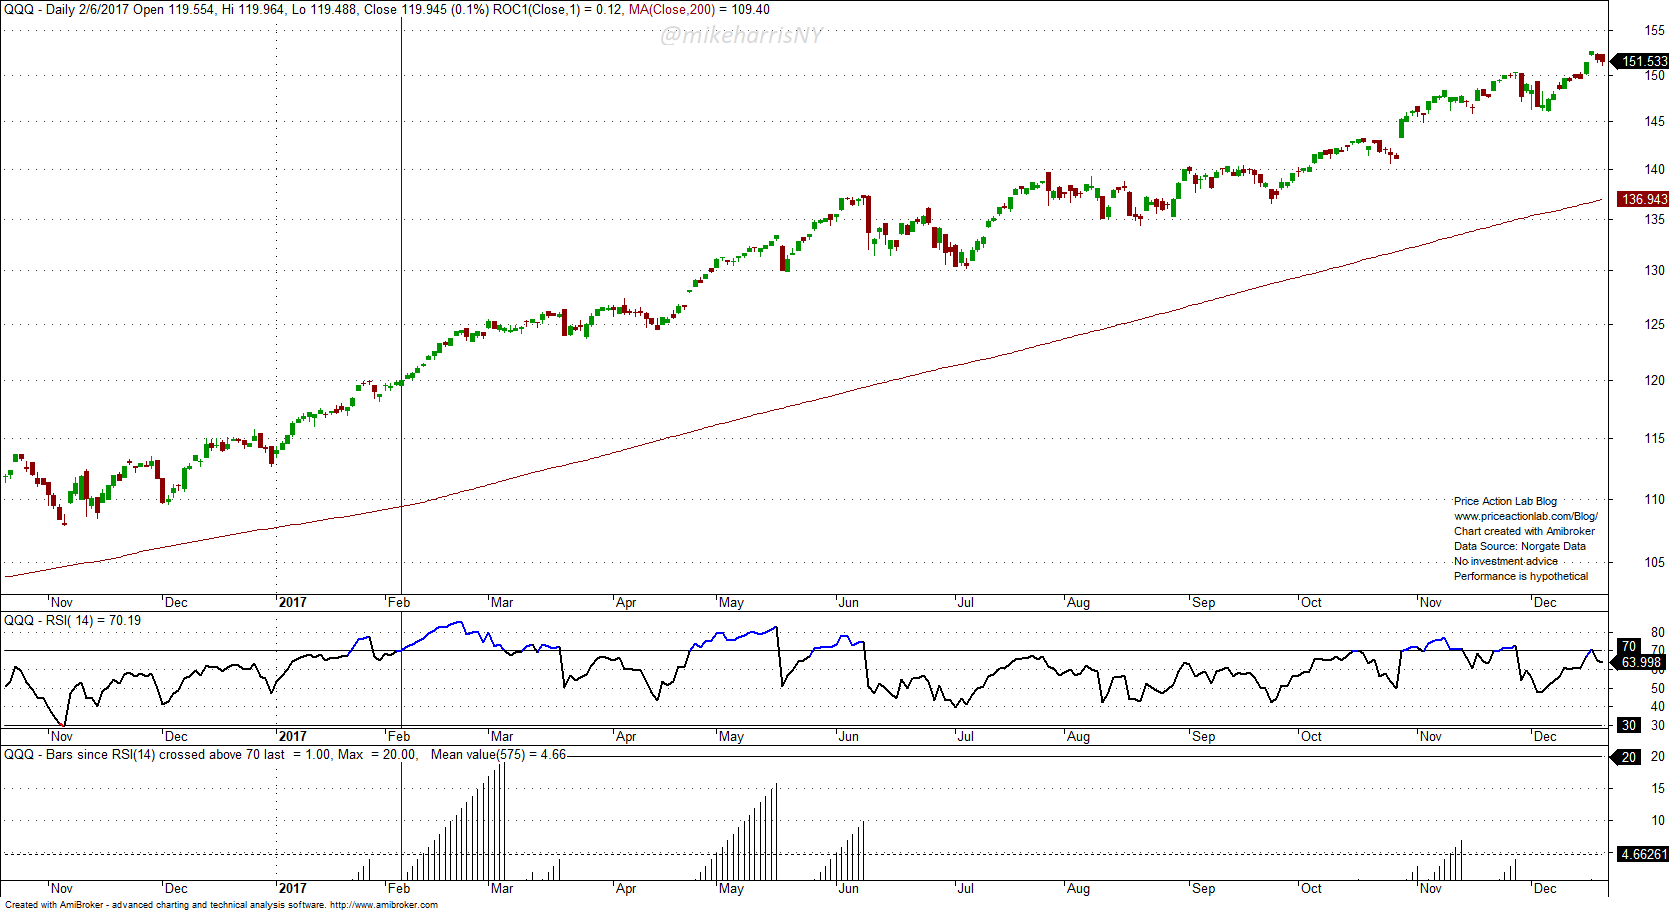
The vertical blue marker shows the beginning of a 20-day overbought period in early 2017. As traders say, “The market can remain overbought for longer than shorts can remain solvent.” Most bears are tempted to go short after a few days of persistent overbought conditions. Even if they make some profits 80% of the time by exiting fast, those evaporate due to tail events.
The markets, indicators, and trading strategies suffer from distribution tails, whether exponential or even fat. Understanding these realities of the market is of paramount importance to success. For example, a strategy of actually going long when equity markets first become overbought may be better than waiting for a few days of overbought conditions and then going short. The outcomes also depend on the nature of the strategy. Furthermore, oversold conditions can remain in place for a relatively shorter period as compared to overbought conditions. Mean-reversion traders usually take advantage of this fact.
Trading overbought and oversold conditions is risky because of distribution tails. In our premium reports, we focus on extreme tail events and try to identify candidate stocks that may offer good setups.
Premium Content
By subscribing you have immediate access to hundreds of articles. Premium Articles subscribers have immediate access to more than two hundred articles and All in One subscribers have access to all premium articles, books, premium insights, and market signals content.
Free Book
Subscribe for free notifications of new posts and updates from the Price Action Lab Blog and receive a PDF of the book “Profitability and Systematic Trading” (Wiley, 2008) free of charge.
Disclaimer: No part of the analysis in this blog constitutes a trade recommendation. The past performance of any trading system or methodology is not necessarily indicative of future results. Read the full disclaimer here.
Charting and backtesting program: Amibroker. Data provider: Norgate Data
If you found this article interesting, you may follow this blog via RSS, Email, or Twitter.


