


If there is a vomiting camel pattern, we should also have a golden pliers pattern, the one that formed in the S&P 500 a few days ago and as of the close of March 2, 2023.
This is the chart with the “golden pliers pattern” in S&P 500 index.

The “golden pliers pattern” is formed when the 50-day moving average has just crossed above the 200-day moving average, a golden cross, and the daily candle is trapped in inside the two moving averages. There is also the “death pliers pattern” formation when the averages cross to the downside and the daily candle is trapped inside the cross.
Fine, this is a quantitative blog, and so far this has been entertaining. Is this novel pattern any good?
This has been a rare pattern in S&P 500, with only seven occurrences since 1960, although that can vary by adjusting the tolerance in the formation. The win rate has been about 48% for 50 day holding period, a coin toss.
I backtested this pattern on 32 ETFs starting in January 2000 and this is the equity curve for equal position size.

After 2009 (surprise?) this “golden pliers pattern” shows a positive bias for 50 day holding period. Some of those ETFs have already a positive bias in the test period, but this is another issue with the common pattern backtests in the financial blogosphere we have talked about in this blog in the past.
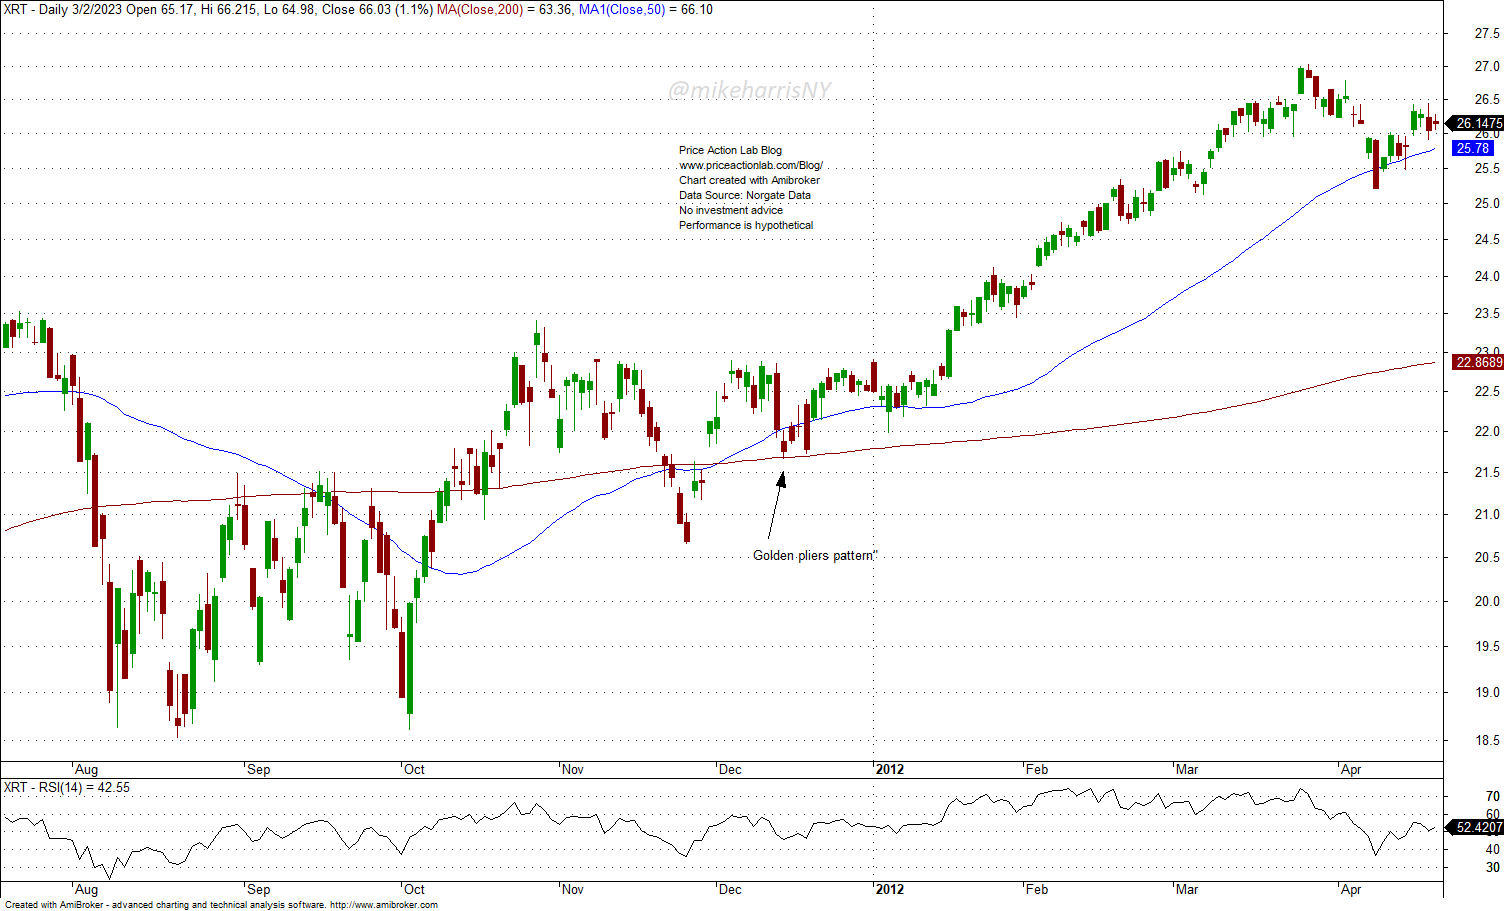
One of the most profitable trades with a gain of 17.5% was in XRT ETF on December 14, 2011.
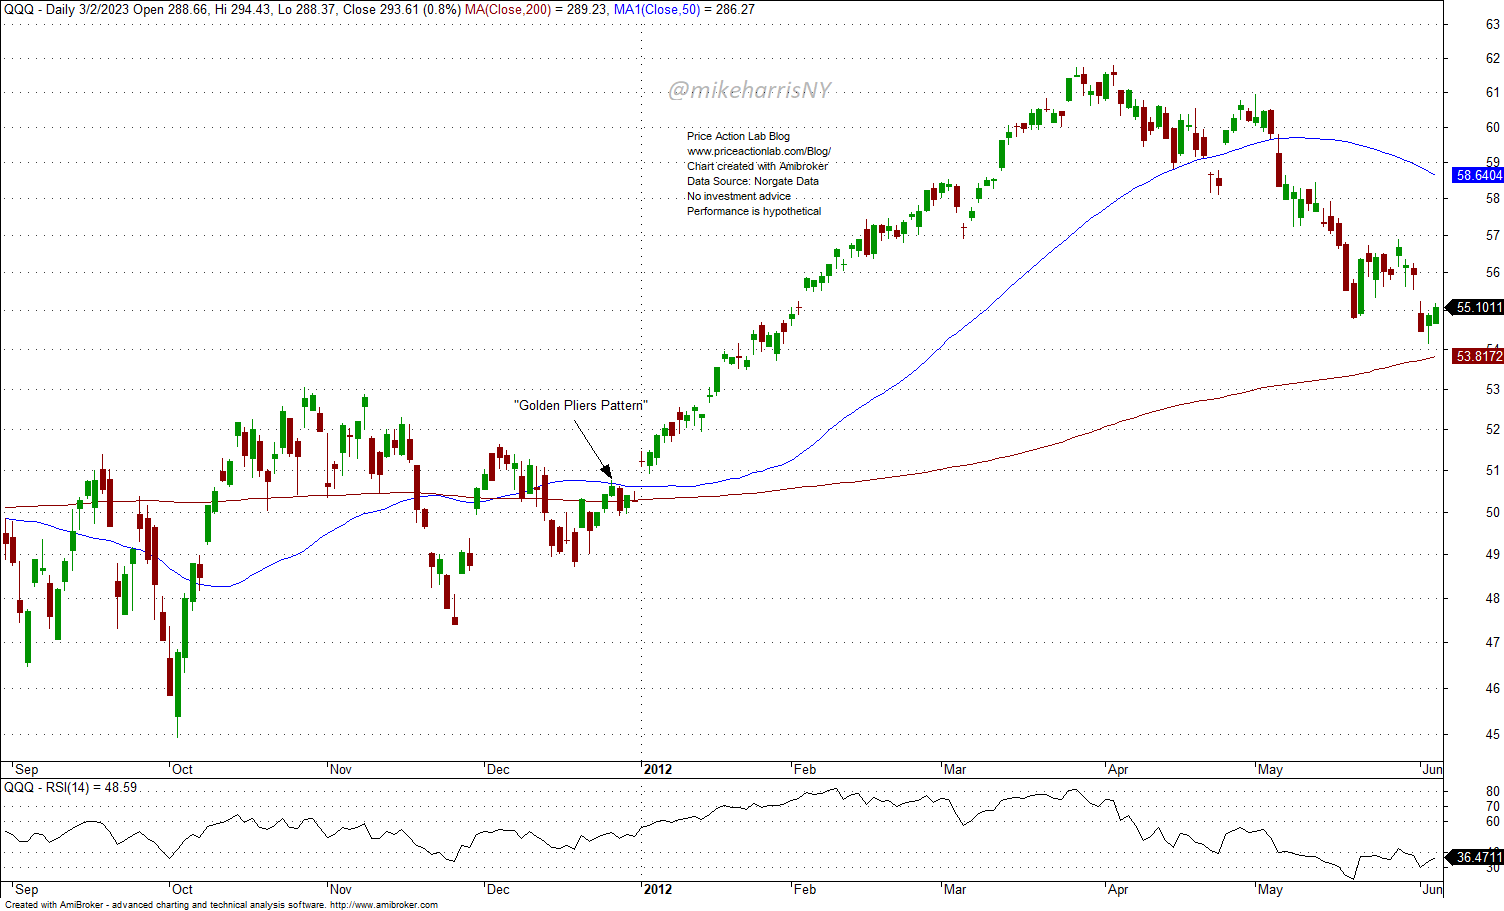
Another profitable pattern was formed in QQQ ETF on December 27, 2011, for about 16% gain after 50 days.
A “golden pliers pattern?” Why not! Traders still love patterns, and algos are always looking for ways to profit from what traders think is a good pattern…
15% off all premium content with Discount Code PAL15
By subscribing you have immediate access to hundreds of articles. Premium Insights subscribers have immediate access to more than a hundred articles and All in One subscribers have access to all premium articles, books, premium insights, and market signals content.
Free Book
Subscribe for free notifications of new posts and updates from the Price Action Lab Blog and receive a PDF of the book “Profitability and Systematic Trading” (Wiley, 2008) free of charge.
Disclaimer: No part of the analysis in this blog constitutes a trade recommendation. The past performance of any trading system or methodology is not necessarily indicative of future results. Read the full disclaimer here.
Charting and backtesting program: Amibroker. Data provider: Norgate Data
If you found this article interesting, you may follow this blog via RSS, Email, or Twitter.


