


In this article we compare the out-of-sample performance of a trading strategy and a machine learning model that use the exact same features.
The most important aspect of machine learning is the availability of features (also known as attributes or predictors) that can be used to train a model, test it and then validate it. The final application of machine learning is in most cases a routine task as long as the relevant features are already identified. However, in most cases, a fixed model, or strategy in the case of trading, can also do a good job. The question is: What are the advantages of applying machine learning when in reality the important part is identifying the right features to use?
An answer to the above question is that machine learning can also determine the significance of the features and deal with a large number of them. However, in some cases it is already suspected that the features are highly significant and could be used in a fixed strategy instead of using machine learning to generate predictions. There are virtually no papers that we know of that address this issue. In this study we compare the out-of-sample performance of a simple fixed strategy with two features to a machine learning model that uses the same exact features.
Generating the features
As already mentioned, success in applying machine learning largely depends on the quality of the features. In this article, we use features identified by a proprietary deep learning algorithm applied to SPY ETF historical daily data. Below is the DLPAL PRO workspace used to generate 2000 instances (rows) of four features: the daily directional long and short biases, their difference and the significance of the biases.
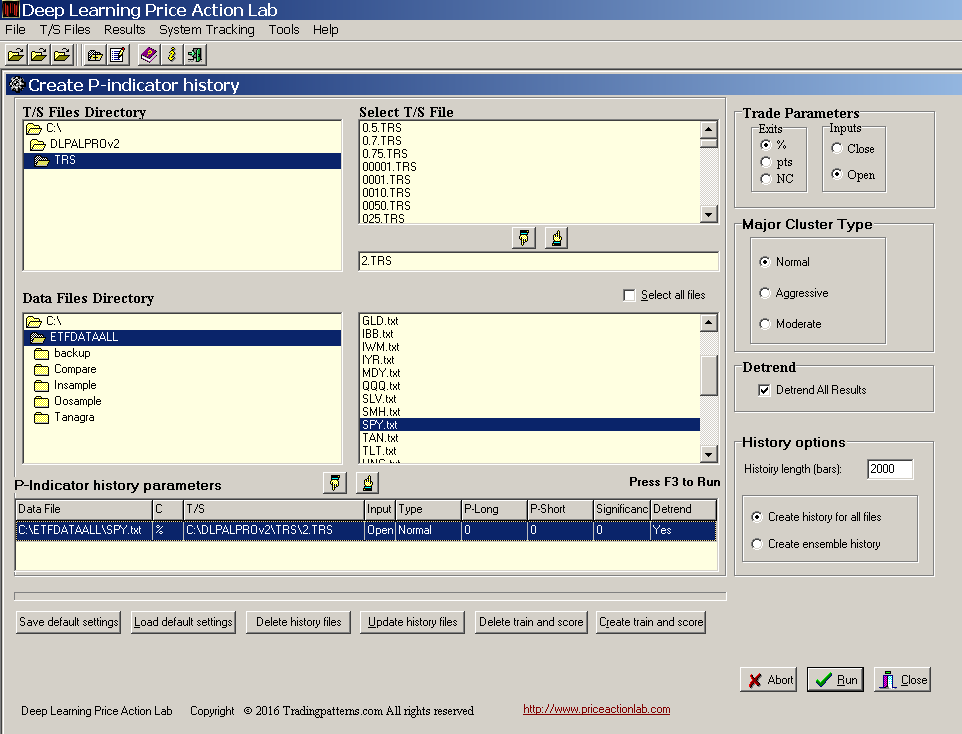
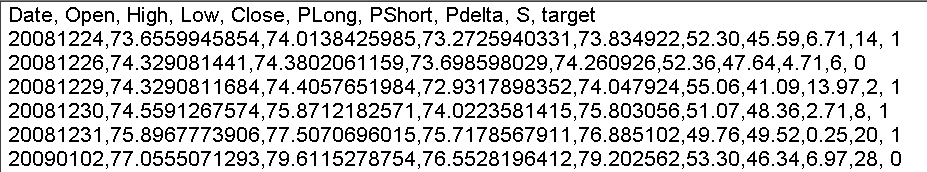
Note that DLPAL PRO can generate files with feature values for an unlimited number of securities (subject to memory limitations.) In this case we generated a file for SPY with 2000 instances going back to 12/24/2008 with last date 12/02/2016. Therefore, there is eight years worth of history for the features in the file. A screenshot of a few lines of the generated file is shown below:
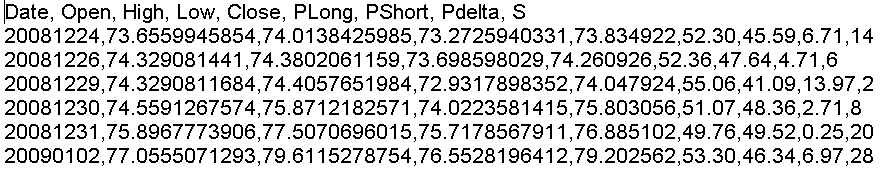
The labels for the features are: PLong, PShort, Pdelta and S, for the long and short directional biases, their difference and significance, respectively. The features values are added after the Close values of the original SPY historical data file in each row. In this way, the file can be used to backtest fixed strategies of features directly.
DLPAL PRO also generates train/test and scoring files for machine learning, as shown in previous articles. The program can also update all files as new data are added.
The historical file with the features is next split in half to generate an in-sample and an out-of-sample file. The in-sample is used for parameter optimization in the case of fixed strategy and for train/test in the case of machine learning. The out-of-sample is the validation segment of the data. All backtests include commission of $0.01 per share and are based on 100K initial capital.
Fixed strategy
We select two of the features, PLong and PShort and we optimize the following strategy in the in-sample:
Buy if PLong > a
Sell if PLong < b
Short if PShort > a
Cover id PShort < b
The optimum values for highest CAR are 55 for a and 50 for b. These optimum values result in a long-only strategy. The values make sense because we want to go long when there is momentum increase and the positive bias PLong is large. Also, we want to exit when the bias disappears.
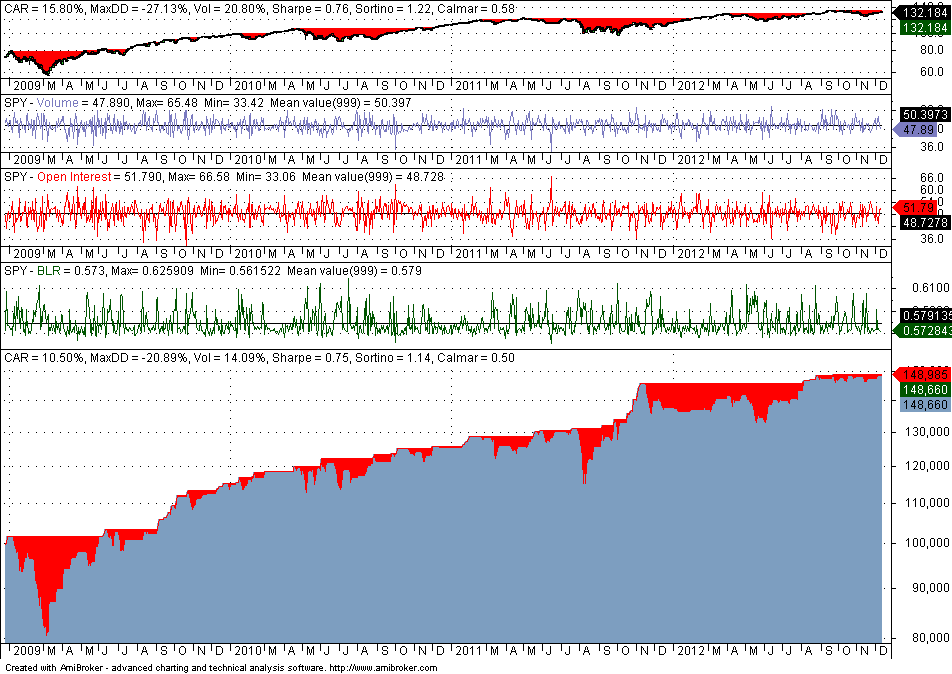
Below is the in-sample performance (12/24/2008 – 12/12/2012)
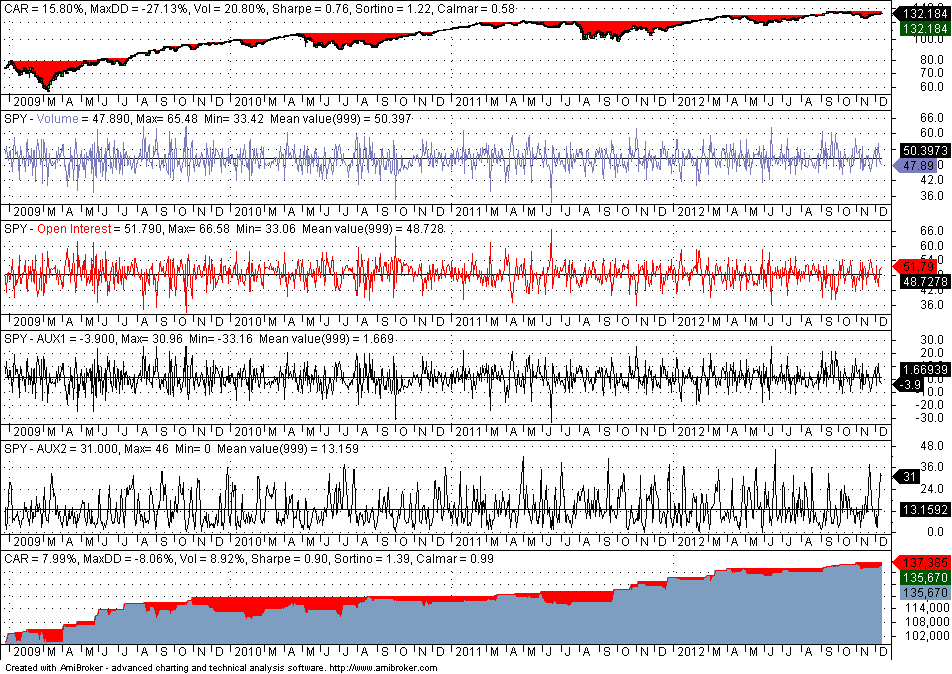
The above chart shows a chart of SPY, charts for all four features with mean, max and min values, and the equity curve for optimum parameter selection. Note that Volume is PLong, Open Interest is PShort, AUX1 is Pdelta and AUX2 is S.
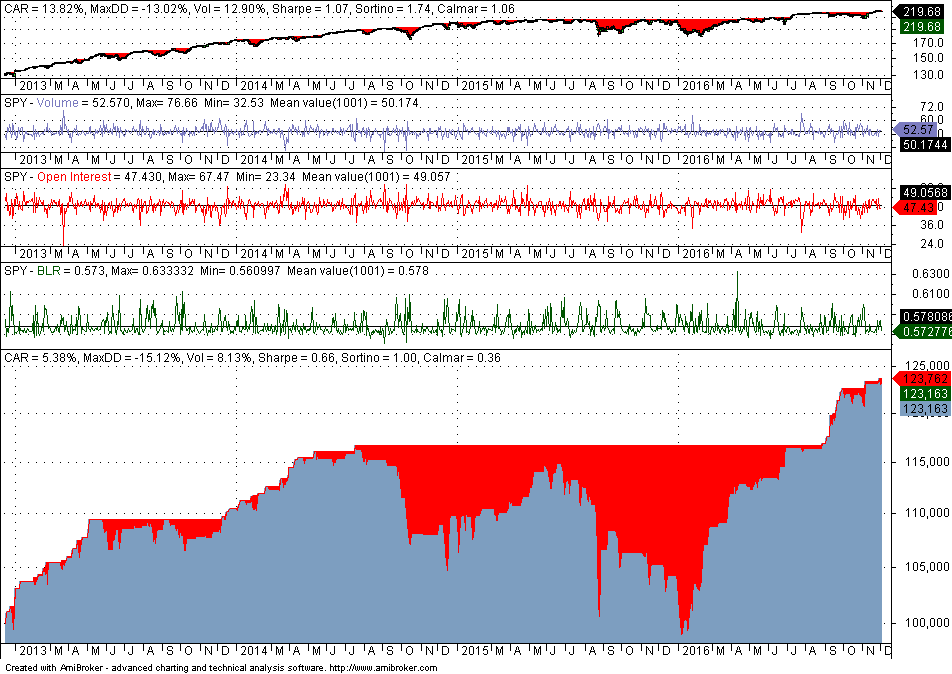
The in-sample performance is not useful other than determining the Sharpe ratio, which is 0.90 in this case. Some quants believe that out-of-sample performance is significant if the Sharpe ratio is at least half that of the in-sample performance. Below is the performance in the out-of-sample:
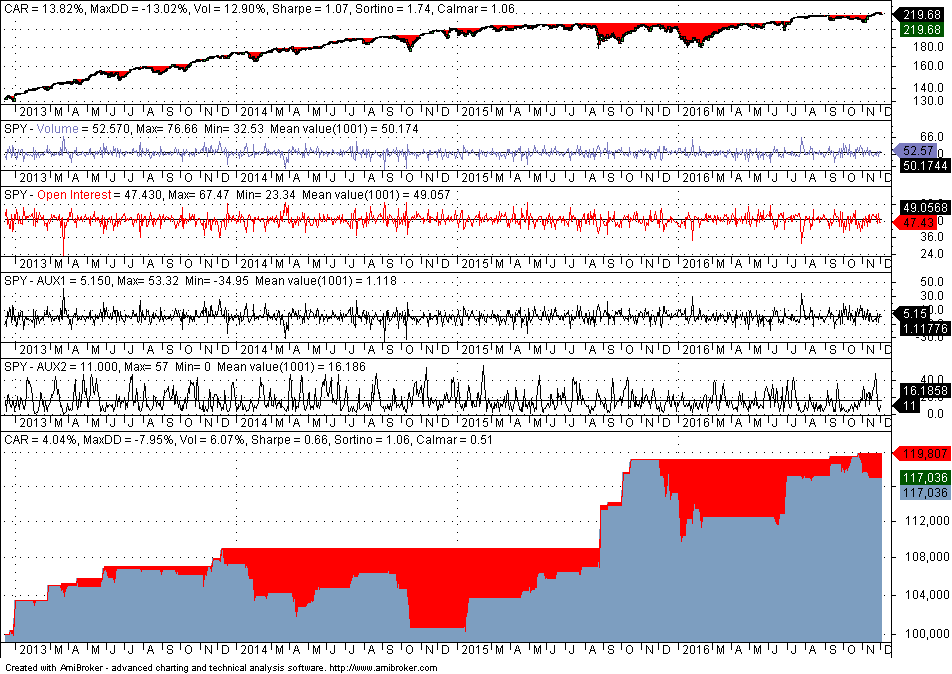
The out-of-sample Sharpe of 0.66 is about 75% of the in-sample Sharpe and this means that our strategy development process is validated. Note that we are not validating a strategy to trade here. We are only validating some general process of developing strategies based on the particular features. Apparently many quants, especially the novice, do not understand this distinction. Developing a final strategy requires much more than a validation test and the procedure followed is often considered an edge by most quants.
The conclusion is that even in the presence of harsh market conditions in the out-of-sample from 12/13/2012 to 12/02/2016, the fixed strategy performed relatively well, given also that the parameters were optimized in the in-sample.
Machine learning model
The machine learning model is simple in this case because there are only two features used and it is used for illustration purposes only. We sample 50% of the in-sample randomly and train a Binary Logistic Regression (BLR) classifier using the train files generated by DLPAL PRO. A screenshot of a few lines of the file is shown below:
Note that the train/test file is identical with the features file but it also includes a binary target, based on the sign of next day’s return: 1 if the next day return is positive and 0 if it is negative. The binary target allows the classifier to perform supervised learning, as opposed to unsupervised where there is no target.
The train sample error was 0.4208 and the error in the test sample that used the unselected 50% instances was 0.4540. Based on the calculated coefficients in the train sample, we implemented the BLR function in Amibroker. The combined in-sample performance is shown below:
Sharpe is 0.75 but CAR is significantly higher than that achieved by the optimized fixed strategy. This tells us that the machine learning model may have more potential. Note that the minimum value of the BLR function is much above 0.50, meaning that only long trades are taken and this agrees with the fixed strategy. Since the average value of the BLR function is about 0.58, we elect to trigger long positions when the calculated probability is higher than 0.58.
Below is the out-of-sample performance using the exact same BLR function and the same trigger for long positions:
Although the out-of-sample Sharpe is 88% that of the in-sample, maximum drawdown is much higher at 15.17% versus 7.95% for the fixed strategy. However, CAR is higher for the machine learning model and the performance represents just one possible path given the specific market conditions.
Note that we have not developed a model to use in actual trading. This requires doing far more than a simple exercise in machine learning. What we have done is to validate the process that used the specific features. But this is a very important step that sets the foundations for developing an actual trading strategy.
The next step involves using all four features and possibly some feature engineering. The same principles as above apply also in this case.
If you have any questions or comments, happy to connect on Twitter: @priceactionlab
You can download a demo of DLPAL from this link. For more articles about DLPAL and DLPAL PRO click here.


