


The short-term trend-following trading strategy for futures described in this article makes use of features generated by machine learning in the weekly timeframe.
Most developers of long-short strategies use standard machine learning algos and common features. We use machine learning to engineer features that can be used in simple strategies based on a proprietary process. The features are generated by DLPAL LS software.
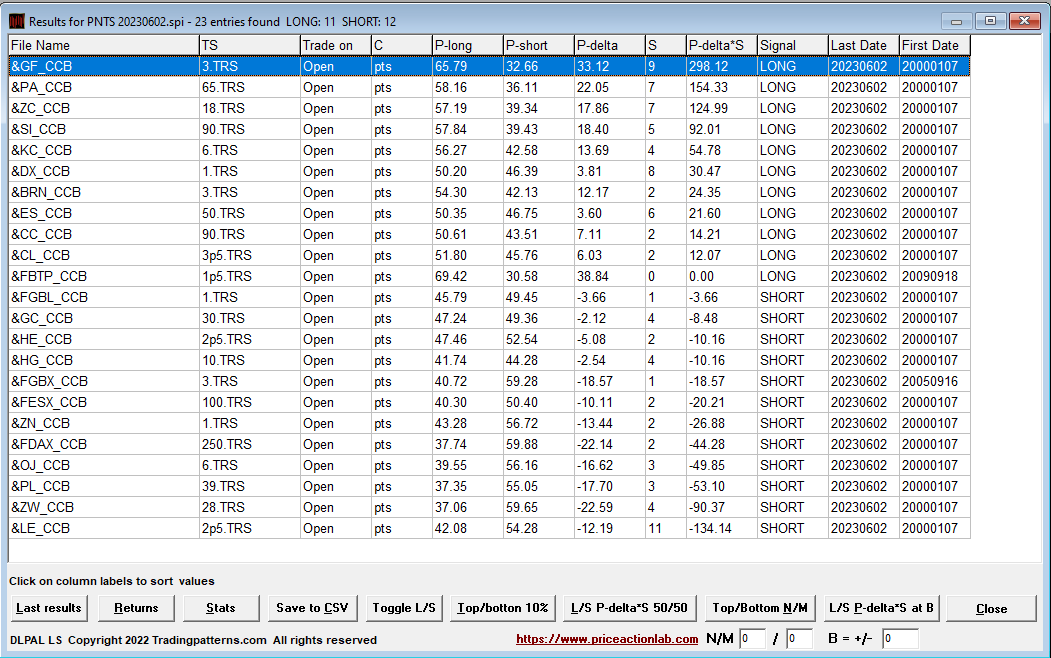
Below is an example of weekly feature generation with DLPAL LS and 23 futures contracts. We use weekly continuous back adjusted series since 01/2000 from Norgate Data. The results are as of the close of Friday, June 2, 2023.
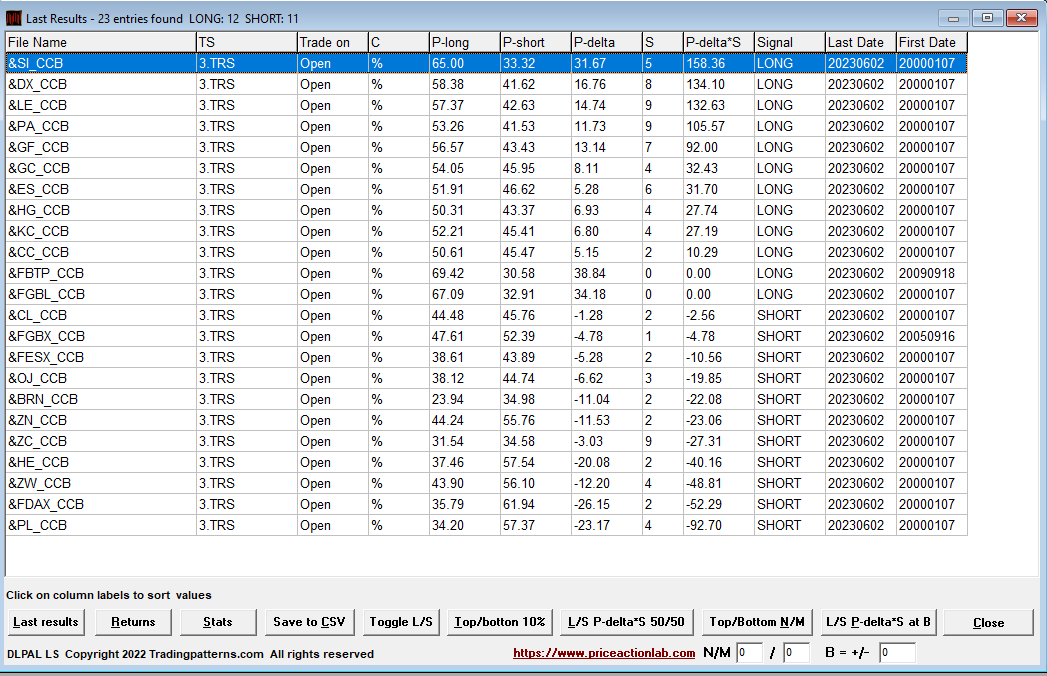
P-long and P-short are the long and short directional biases, respectively. P-Delta is the difference between P-long and P-short. S is a measure of the significance of the P-Delta. The results are sorted for the highest product P-delta x S and indicate 12 long signals and 11 short.
We used a 3% profit target and stop-loss for the above results to classify the weekly features. This can be done straightforwardly in DLPAL LS by creating a workspace with a single line that points to the weekly data of the 23 futures.
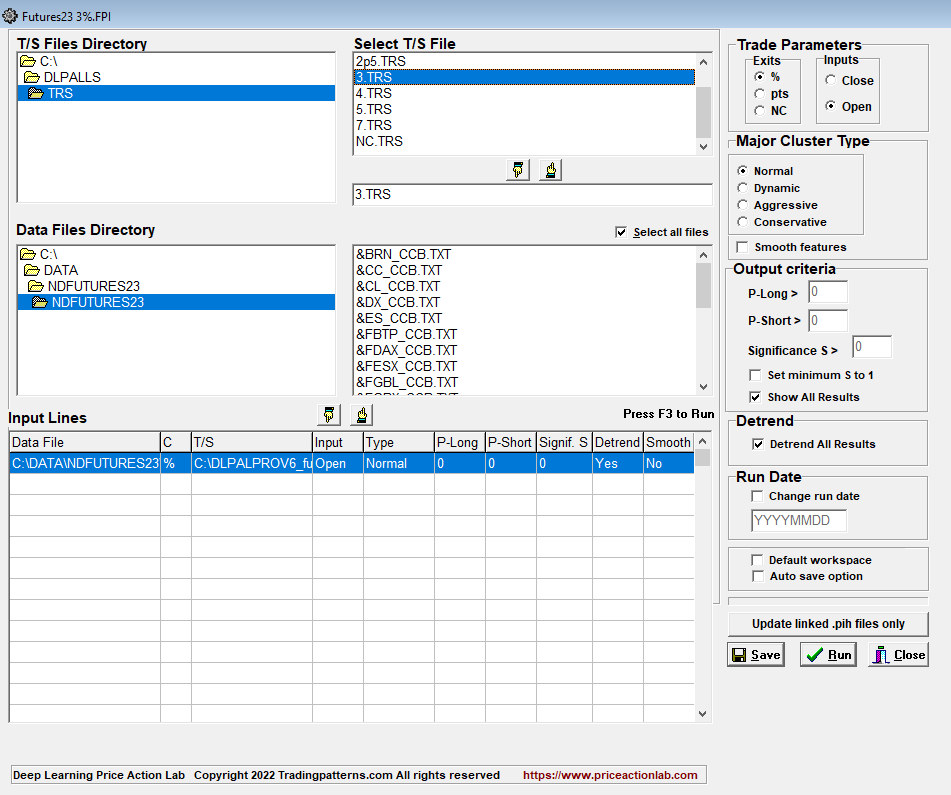
After the close of every week and an update of the data, we run the workspace to get the results for the positions.
Alternatively, strategy developers may desire to use profit targets and stop-loss in points. As an example, we can set the values for the profit target and stop-loss equal to the standard deviation of the weekly returns of each futures contract. We used the Price Series Statistics tool of DLPAL LS for this purpose. Below is a workspace to accomplish that.
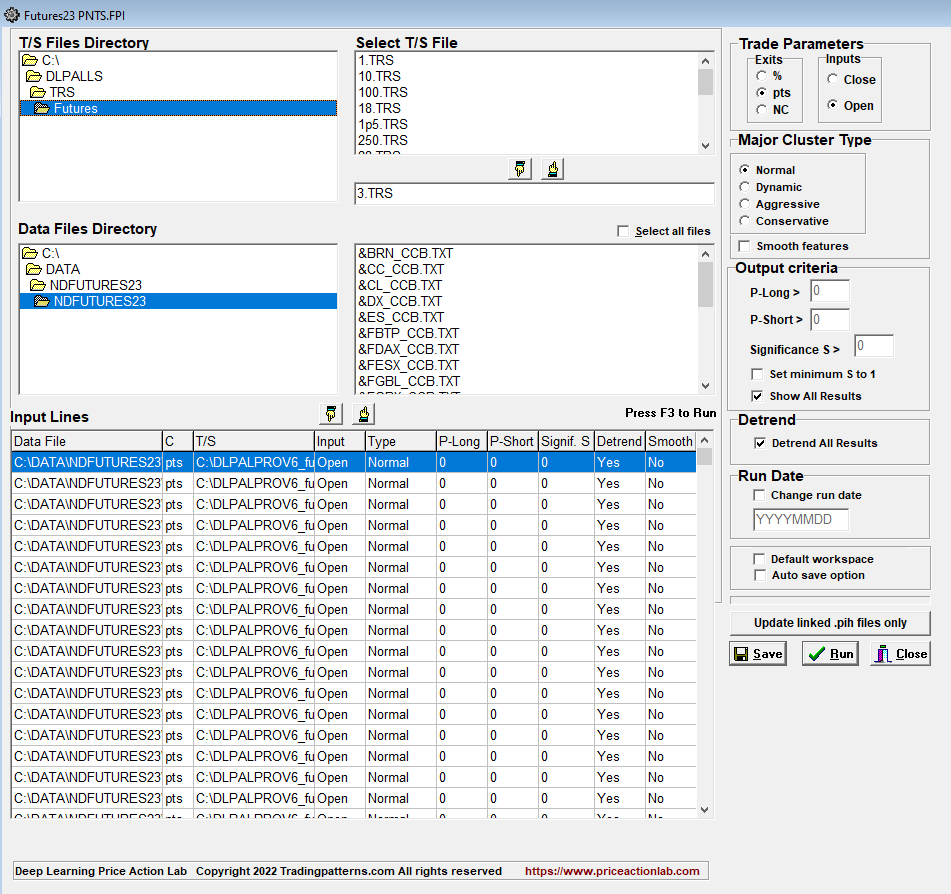
The workspace has 23 lines, one for each futures contract, pointing to a different file with the profit target and stop-loss in points. Below are the results, as of the close of Friday, June 2, 2023.
Also in this case, after the close of every week and the update of the data, we run the workspace to get the results about the new positions.
Backtesting historical performance
DLPAL LS is a tool traders can use in discretionary trading to calculate the directional bias of markets and use that as information with other indicators. In this case, backtesting is not required. The DLPAL LS program can calculate the features’ historical values for developing trading strategies. This was done as an example for the simpler case of the 3% profit target and stop-loss. Then, a simple strategy was backtested as follows:
Long = P-delta > 0
Short = P-delta <-20
For short signals, we require a stronger signal than for long, hence the difference in the P-delta threshold. In addition, the strategy uses a stop-loss based on a 10-week ATR. The position size is determined based on the stop value and a maximum risk percent of 0.5% of closed equity allowed per position.
The period of the backtest is 01/06/2017 to 06/02/2023. The data before that were used to calculate the features. The equity curve, drawdown profile, yearly returns, and histogram of weekly returns are shown below.
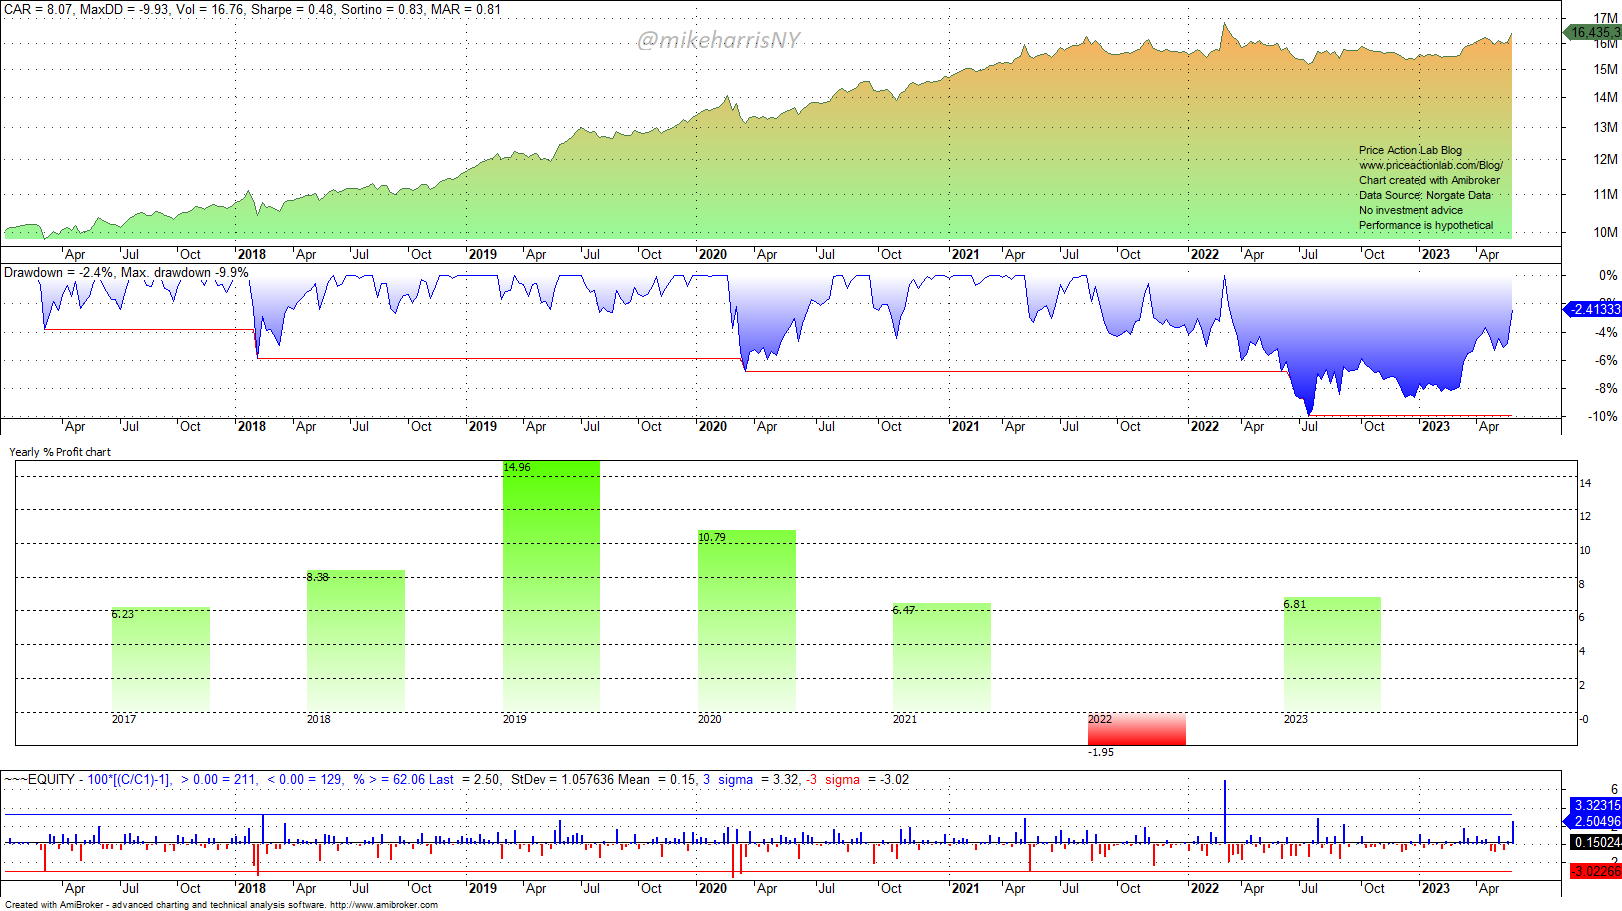
The annualized return is 8.1% at about a 10% maximum drawdown. These results offer some room for leveraging, preferably up to 1.5x.
More advanced strategies can be developed with machine learning. DLPAL LS can update the features’ historical data and generate train and score files. The possibilities are virtually unlimited in terms of feature generation with different classification and their use in developing strategies.
For more information about DLPAL LS and more articles click here.
The program manual can be found here.


