


Chasing bubbles during the last stages of their formation results in a much lower return to risk ratio as it is shown below with examples from bitcoin and Amazon stock.
Venture capitalists understand diminishing returns and usually cash in after an IPO. But many investors and traders are deceived by charts that appear exponential to think that returns also increase exponentially. This is not the case if in the past there were significant corrections because prices start from lower levels and return potential decreases significantly. This is best illustrated by a few examples.
Bitcoin
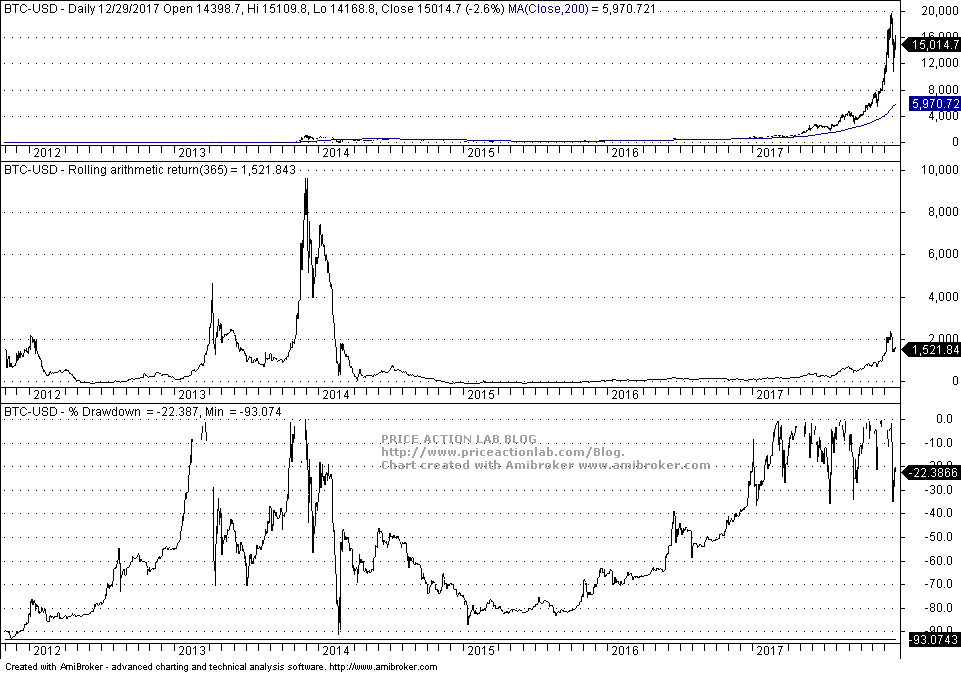
The 365-return reached as high as 9,600% during November 2013 when it appears that many early investors got out. The maximum drawdown before the top was about 70% and that translates to a Return/Risk ratio of about 137. The current value of this ratio is about 43, which is obtained by dividing the 365-day return of 1,521% by the maximum drawdown of around 35% during this year.
It may be seen that the Return/Risk ratio plunged from 137 in late 2013 to about 43 as of today. This is an effect of diminishing returns as the bubble enters its last phases.
AMZN
Price action in AMZN in early stages after IPO has some similarities with that of bitcoin as discussed in another article. (That article was plagiarized by a shameless and unethical wannabe and published in MSM without offering any credit.)
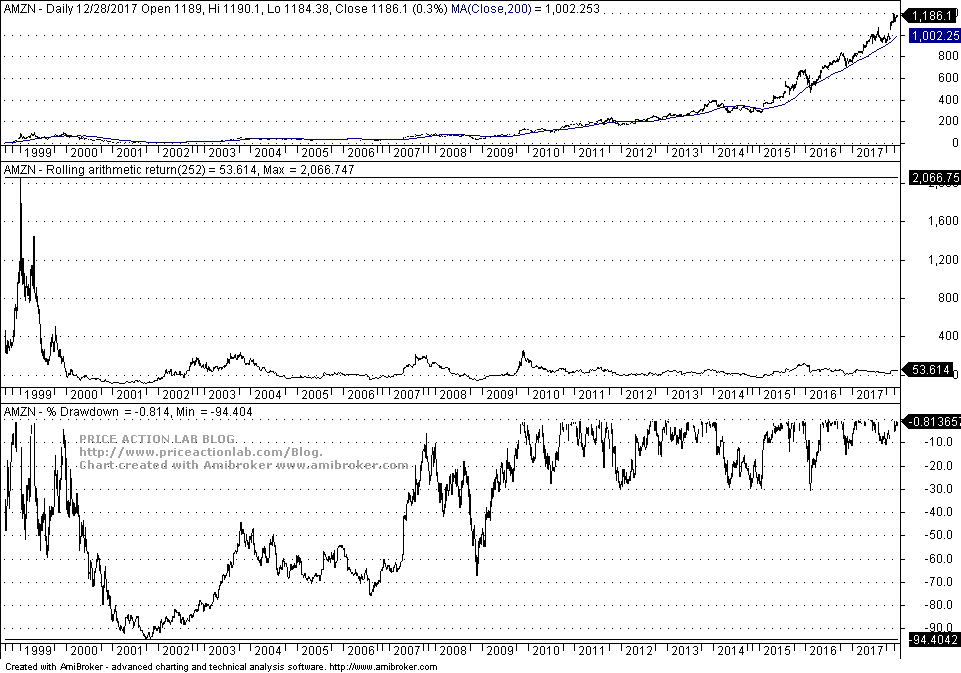
In this case the highest 252-day return was about 2,066% in November 1999. The Return/Risk ratio was around 83 given a drawdown of about 25% in the previous year. At this point the value of this ratio is about 5. This is a dramatic decrease in the ratio from 83 units of return per unit of risk to just 5. Although the stock is rising, return potential is nowhere close where it was in the early stages after the IPO. This is a result of prolonged high drawdown periods as it is shown in the chart above.
There are many other examples that illustrate the effect of decreasing reward/risk ratio after the initial stages of a bubble formation in financial assets. Late investors think they are chasing high returns when in fact they are assuming higher risks. This is the case now in cryptocurrencies and in some technology stocks. Usually these bubbles burst after greedy investors realize that their expectations cannot be met and sell to move to their next target. This is inescapable and marks the fate of all bubbles.
If you found this article interesting, I invite you follow this blog via any of these methods: RSS or Email, or follow us on Twitter
If you have any questions or comments, happy to connect on Twitter: @mikeharrisNY
Charting and backtesting program: Amibroker
Quantitative analysis of Dow-30 stocks and 30 popular ETFs is included in our Weekly Premium Report. Market signals for longer-term traders are offered by our premium Market Signals service. Mean-reversion signals for short-term SPY traders are provided in our Mean Reversion report.


