


A breakout of Gold Miners relative to S&P 500 is no guarantee these stocks will not crash in case there is a stock market correction.
Is this time different because of higher inflation? Maybe it is but maybe it isn’t. Someone posted in social media a ratio chart of GDX and S&P 500 that shows a potential breakout to the upside. The chart started in 2019. Let us look at a longer chart since GDX inception below.
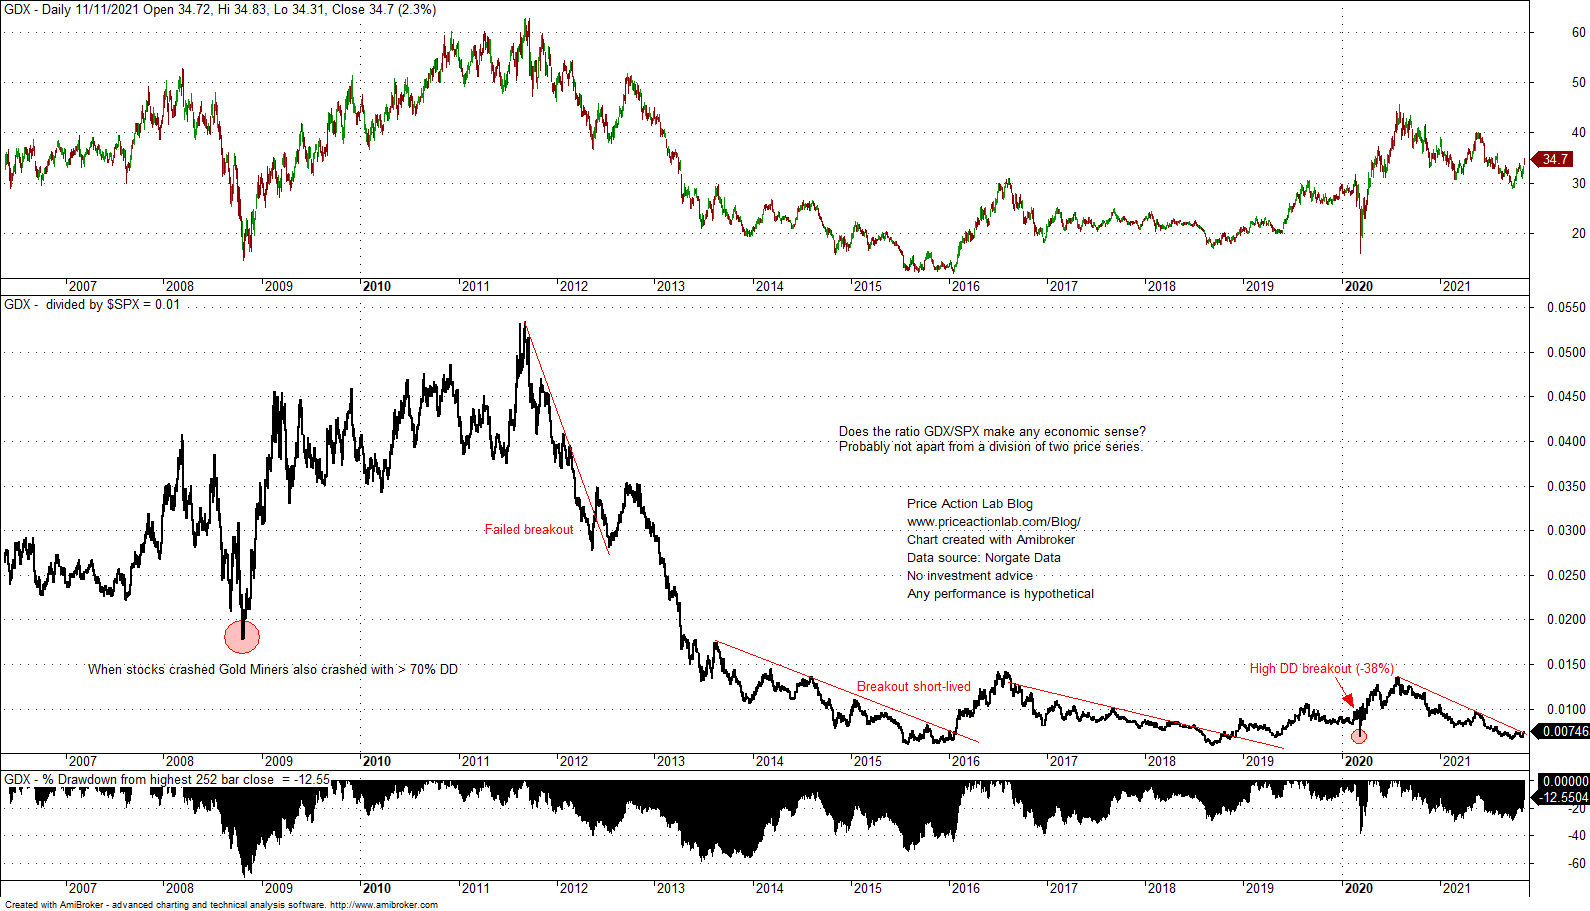
It may be seen that although there was a breakout to the upside in 2007, GDX plunged more than 70% in 2008.
Then in 2012 there was a failed breakout followed by another short-lived one in 2016.
Then, although in 2018 another breakout to the upside occurred, GDX dropped about 40% from 252-day highs in 2020 and more that stocks dropped.
Maybe this time is different; no one can predict what will happen. But these ratio charts lead to some dubious conclusions most of the time. After all, what is the economic justification of dividing Gold Miners by the S&P 500? I have no idea. There are so many conflating factors not reflected in this ratio and also in the ratio of any arbitrarily chosen price series. This chart cannot tell if “this time is different.”
Charting and backtesting program: Amibroker. Data provider: Norgate Data
If you found this article interesting, you may follow this blog via RSS or Email, or in Twitter
Copyright notice: Any unauthorized copy, reproduction, distribution, publication, display, modification, or transmission of any part of this report is strictly prohibited without prior written permission. Disclaimer

10% off for blog readers and Twitter followers with coupon NOW10. Click here.


