


Simplicity wins when it is compatible with the market dynamics. This is the case with the B2S2 strategy for trading Dow 30 stocks. Despite the strategy being long-only and having no filters and no parameters to optimize, it is up nearly 8% year-to-date.
The B2S2 strategy is based on a very simple algo and does not have any bear market filters, or parameters to optimize. Yet, this strategy is up 8% year-to-date with a sample of 322 long trades.
Since 1993, the strategy has generated 10,884 trades. The backtest accounts for delisted Dow 30 securities (Norgate Data). Below is a summary of the performance from 01/02/1993 to 12/02/2022, and a comparison to SPY ETF buy and hold since inception.
Performance Summary
| B2S2 STRATEGY | SPY BUY AND HOLD | |
| CAGR | 19.2% | 9.8% |
| MDD | -29.4% | -55.2% |
| SHARPE | 1.10 | 0.52 |
| MAR (CAGR/MDD) | 0.65 | 0.18 |
| TRADES | 10,844 | – |
| WIN RATE | 65.8% | – |
| AVG. BARS IN TRADE | 6.9 | – |
| EXPOSURE | 41% | 100% |
The Sharpe ratio is higher than 1 and the win rate is nearly 66%. This is a mean-reversion strategy with a payoff ratio of 0.72, but in conjunction with a high win rate, the profit factor is about 1.4 and the result is an expectation of 0.52% per trade.
Equity curve, yearly returns, and drawdown profile
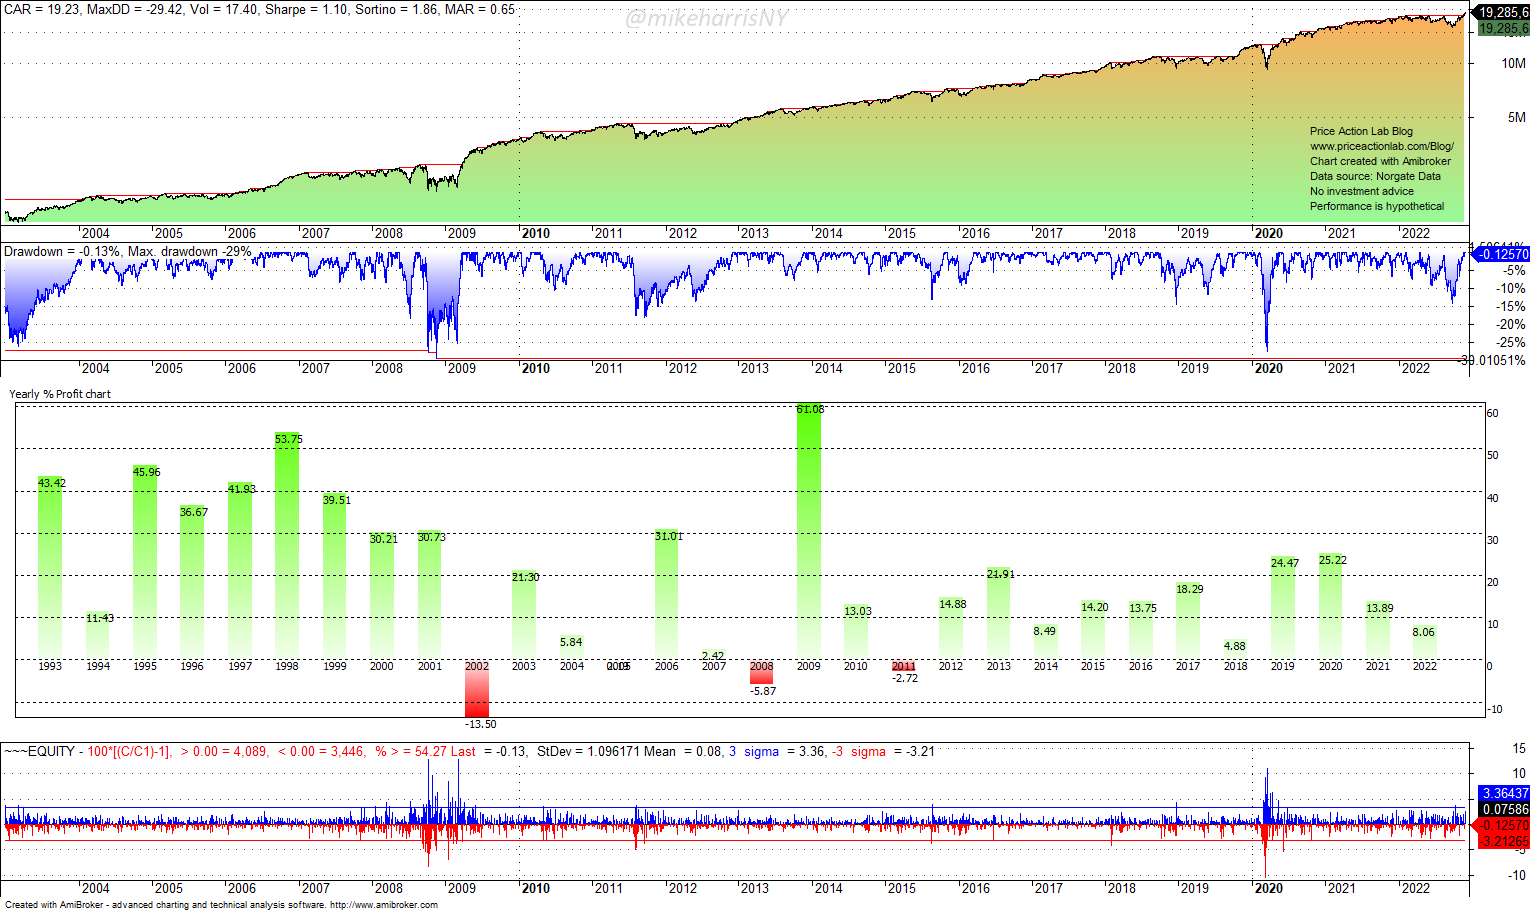
For a simple algo with no parameters to optimize and no filters, it has an excellent equity curve, drawdown profile, and yearly returns sequence. The histogram of daily equity returns (last chart) indicates high stress and volatility during the dot-com and 2020 pandemic crash only.
This strategy has been a winner so far because it is simple, and its simplicity is compatible with market dynamics.
For more details about the strategy click here.
Disclaimer: No part of the analysis in this blog constitutes a trade recommendation. The past performance of any trading system or methodology is not necessarily indicative of future results. Read the full disclaimer here.
Charting and backtesting program: Amibroker. Data provider: Norgate Data
Hypothetical or simulated performance results have certain inherent limitations. Unlike an actual performance record, simulated performance results do not represent actual trading. Also, since the trades have not actually been executed, the results may have under- or over-compensated for the impact, if any, of certain market factors, such as lack of liquidity. Hypothetical trading results are also subject to the fact that they are designed with the benefit of hindsight. No representation is being made that any account will or is likely to achieve profits or losses similar to those shown.


