


Different market regimes may give rise to asymmetries that can persist for many years or even decades. This is the story of the up-versus-down asymmetry in the stock market.
A financial media post yesterday included a chart that showed the asymmetry in performance from holding the SPY ETF after up days versus after down days. Without more context, laypeople could draw the wrong conclusions. This article aims to explain the phenomenon depicted in that chart.
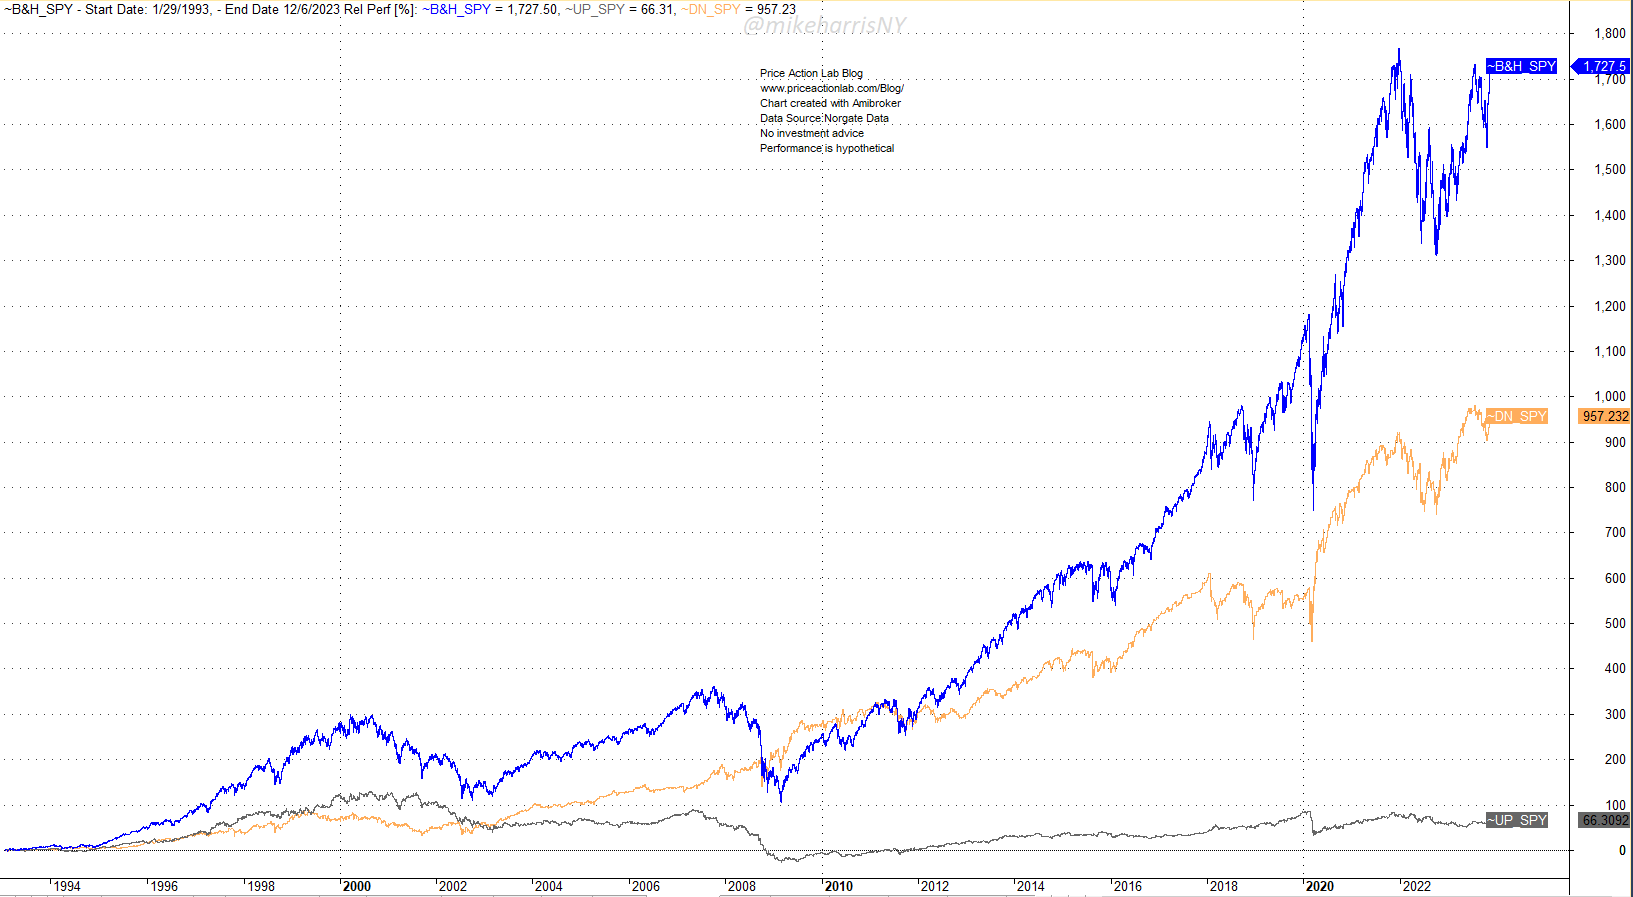
The above chart shows the relative performance of two strategies and compares them to buy-and-hold performance.
The first strategy (gray line) buys the S&P ETF at the close of an up day and exits at the close of the next day. If the ETF is up again on the day, then the strategy buys it again. If the ETF is down, then the strategy remains flat.
The second strategy (orange line) buys the S&P ETF at the close of a down day and exits at the close of the next day. If the ETF is down again on the day, then the strategy buys it again. If the ETF is up, then the strategy remains flat.
We notice a dramatic difference in performance: buying the down days has generated 757.2% returns versus only a 66.3% return for buying the up days.
Two comments before we continue:
(A) The performance did not include transaction costs, and therefore, it depicts some dynamic but not hypothetical performance.
(B) The buy-and-hold performance (blue line) is higher than the performance of the strategy of buying the down days by a factor of 1.8. Therefore, buying after up days has a significant impact on the total return, as expected. I will skip the math.
Next, we add a transaction cost of $0.01 per share. Below is a chart of the relative performance.
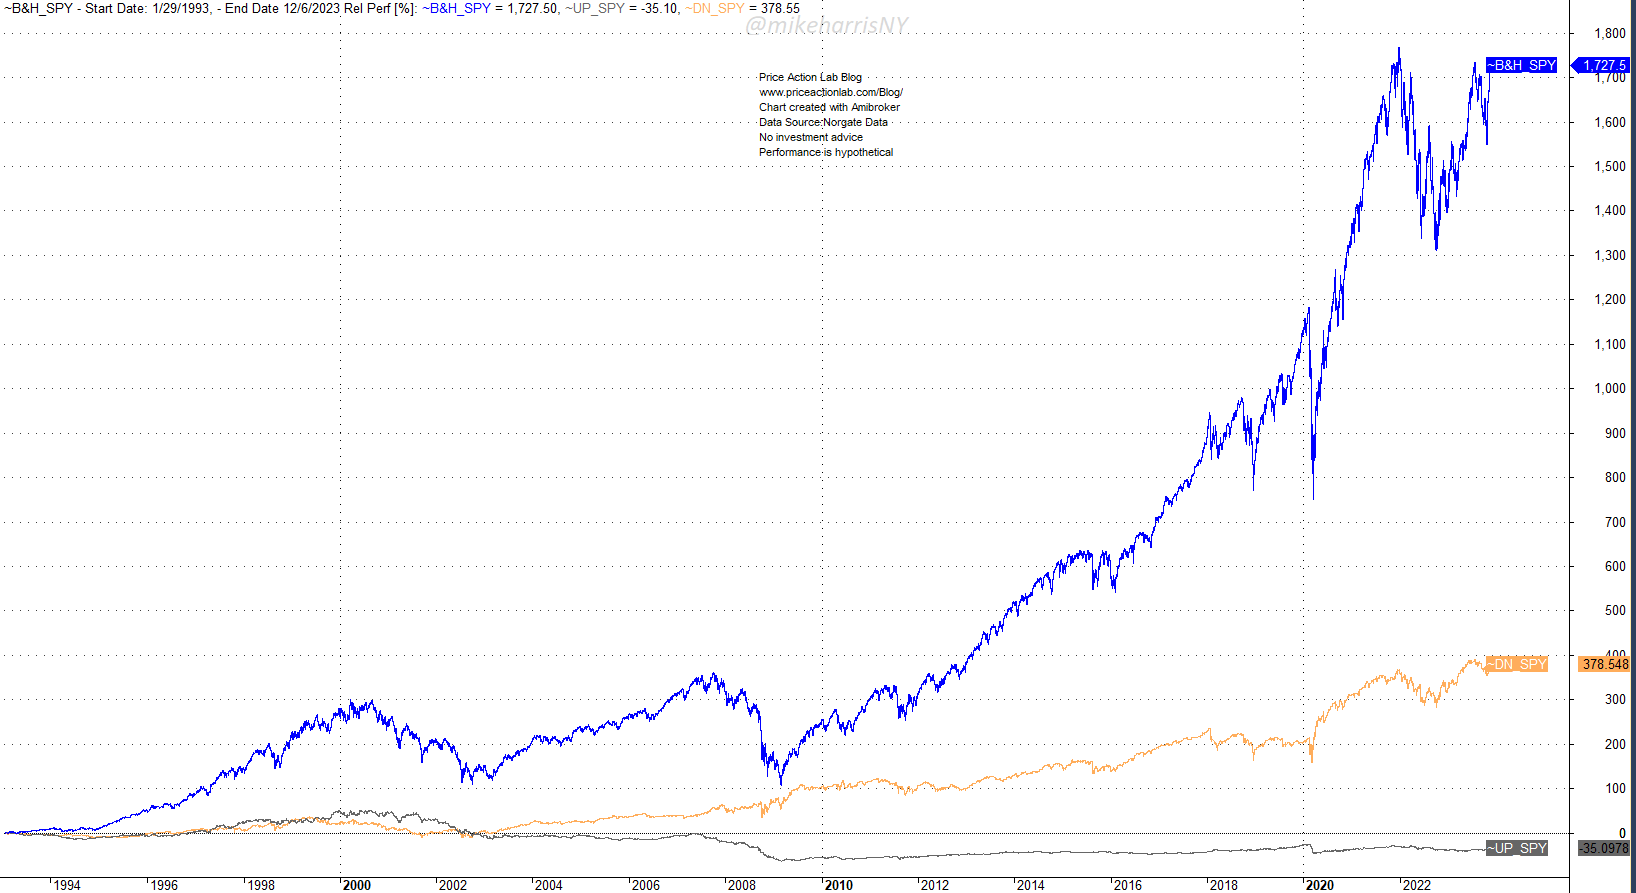
The performance of the strategy of buying after down days craters, and that of buying after up days turns negative. Still, the wide divergence in performance indicates the presence of a market dynamic. But what is it?
This dynamic has been known to market quants for a long time, and there have been several articles in this blog in the last 10 years that have described it and its impact on the stock market, technical analysis, and trading strategy development. Before going into more details, let us look at the backtest of the strategy that buys after down days from 1945 to 1982. In this case, we use S&P 500 index daily data.
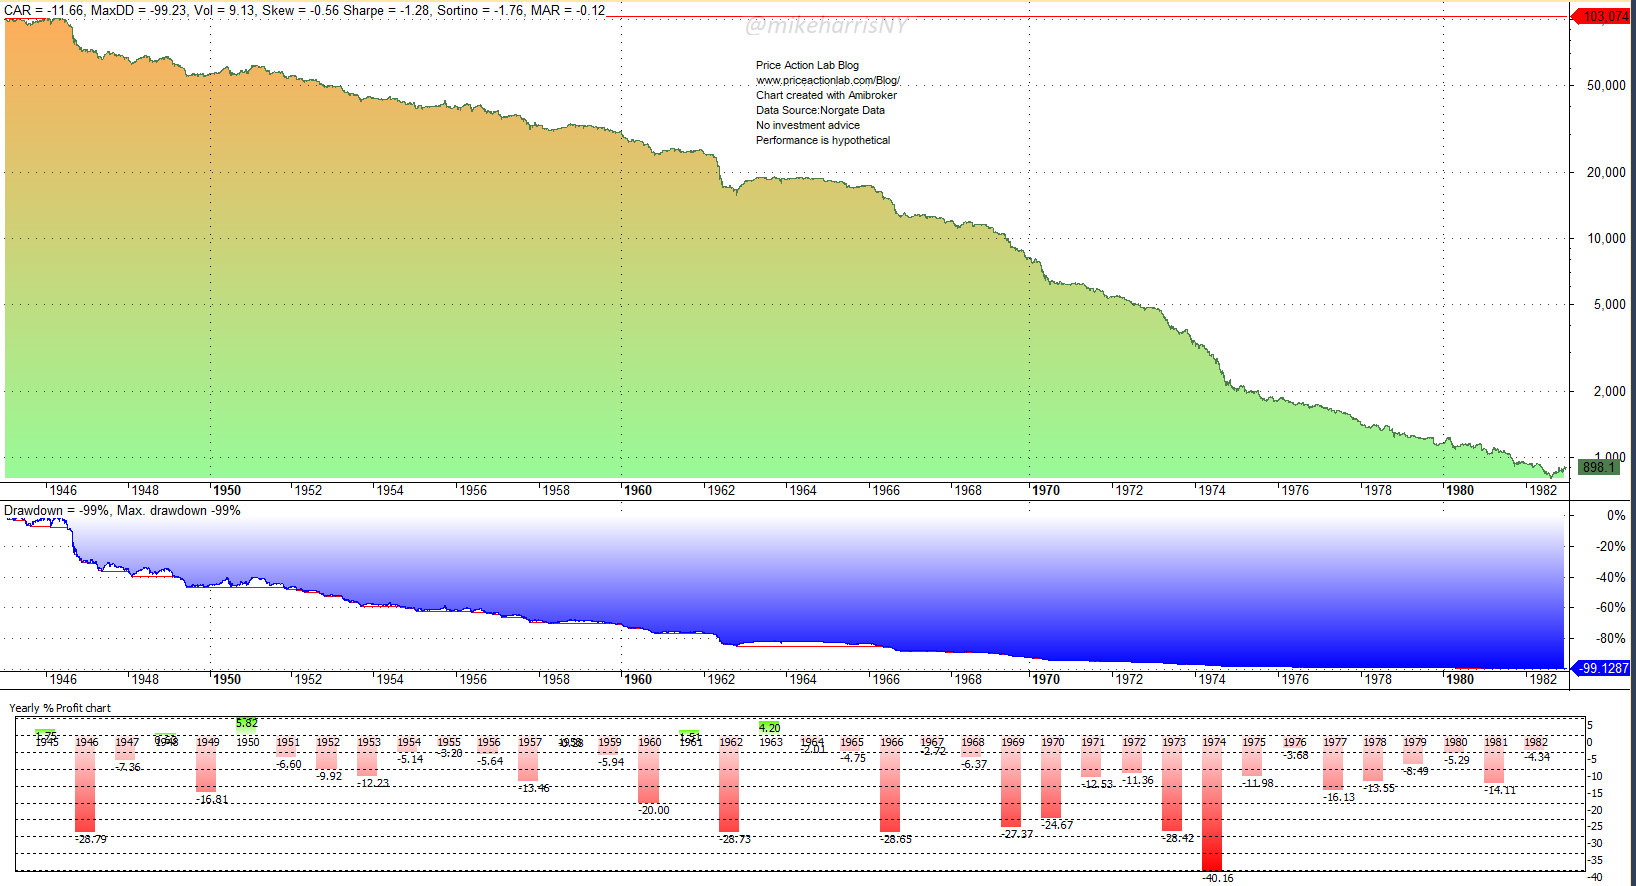
We notice a nearly straight-down line in the log scale, which corresponds to an exponential decay in the linear scale. This means that during that period, this strategy had inverse dynamics: it was highly unprofitable rather than highly profitable.
Here is why: until about 1988, there was a high serial correlation in S&P 500 index daily returns. This means that the probability of up days followed by up days was higher, and the same was true for down days. After that, the dynamic changed, and a new regime emerged with mean-reverting daily returns and a higher probability of up days following down days.
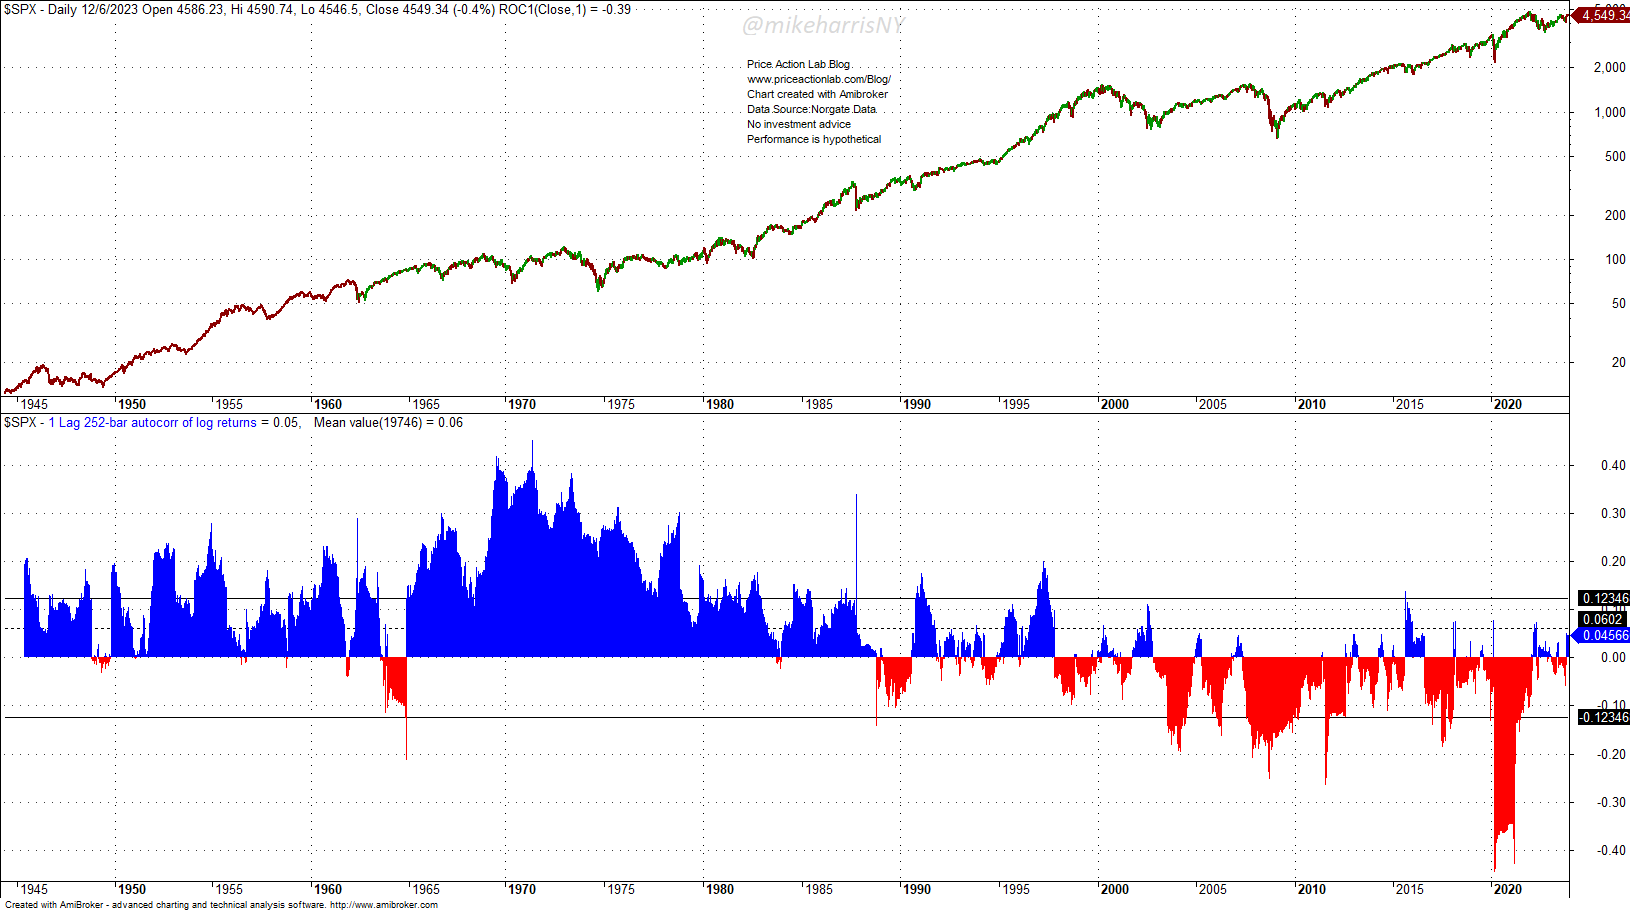
Ten years ago, I conceived an indicator (an oscillator) to describe the serial correlation regimes, and I called it Momersion because it measured the relative strength of momentum (positive serial correlation) and mean-reversion (negative serial correlation).
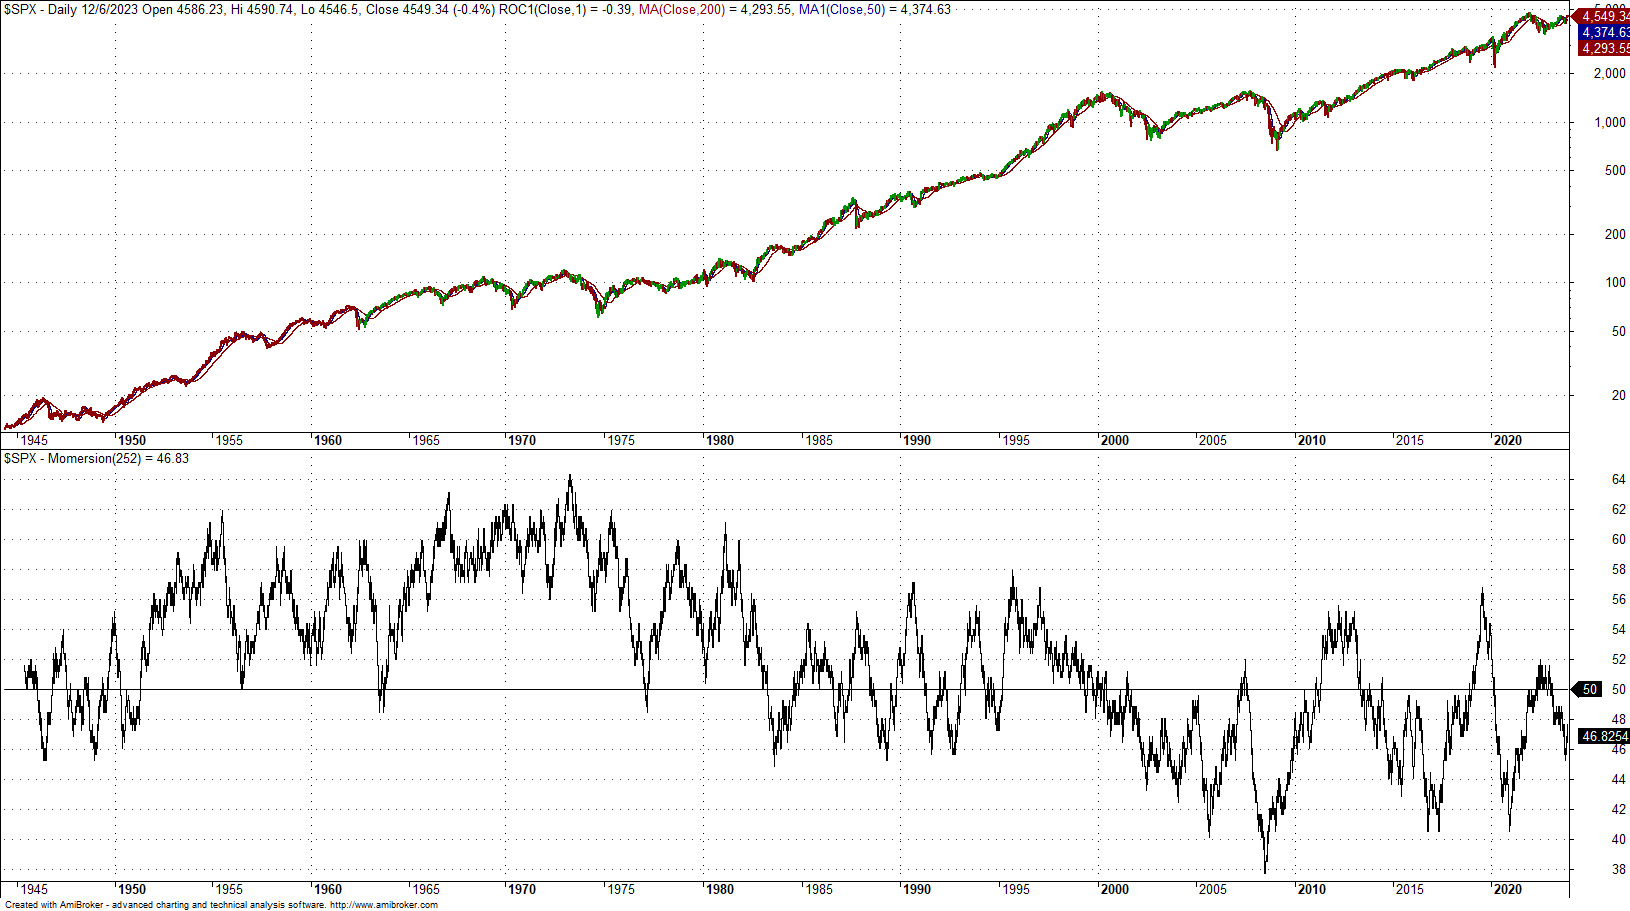
It may be seen that until the early 1980s, Momersion was above 50%, indicating strong momentum, and after a period of whipsaw, it fell below 50%, indicating strong mean reversion.
Is it possible serial correlation will become positive again in the S&P 500?
This is an interesting question, and I have no answer. My feeling is that the odds of this happening are extremely low. However, there may be conditions that will facilitate the return of high serial correlation for an extended period.
Price Action Lab Blog Premium Content
Subscribe for immediate access to hundreds of articles. Premium Articles subscribers have immediate access to more than two hundred articles, and All in One subscribers have access to all premium articles, books, premium insights, and market signal content. NEW! Hybrid Asset Allocation Signals
Disclaimer: The premium articles are provided for informational purposes only and do not constitute investment advice or actionable content. We do not warrant the accuracy, completeness, fitness, or timeliness for any particular purposes of the premium articles. Under no circumstances should the premium articles be treated as financial advice. The author of this website is not a registered financial adviser. The past performance of any trading system or methodology is not necessarily indicative of future results. . Read the full disclaimer here.
Charting and backtesting program: Amibroker. Data provider: Norgate Data
If you found this article interesting, you may follow this blog via RSS, Email, or Twitter.


