

I introduced the notion of momersion in a recent article. In this article I present an indicator of momersion along with simple code for Amibroker.
The Momersion indicator measures momentum and mean-reversion over a specified lookback period n. It is an oscillator (0 – 100) that is calculated as follows:
Momersion(n) = 100 × MOMc/(MOMc+MRc) (1)
where MOMc is a count of momentum and MRc is a count of mean-reversion, calculated as follows (pseudocode):
For lookback period n
MOMc = 0
MRc = 0
For i = 1 to n do
{
If r(i) × r(i-1) > 0 then inc(MOMc)
If r(i) × r(i-1) < 0 then Inc(MRc)
}
}
Momersion(n) = 100 × MOMc/(MOMc+MRc)
where r(k) is the kth arithmetic return.
Below is code for Amibroker. Copy and paste the code in a new formula.
|
This post is for paid subscribers
Already a subscriber? Sign in |
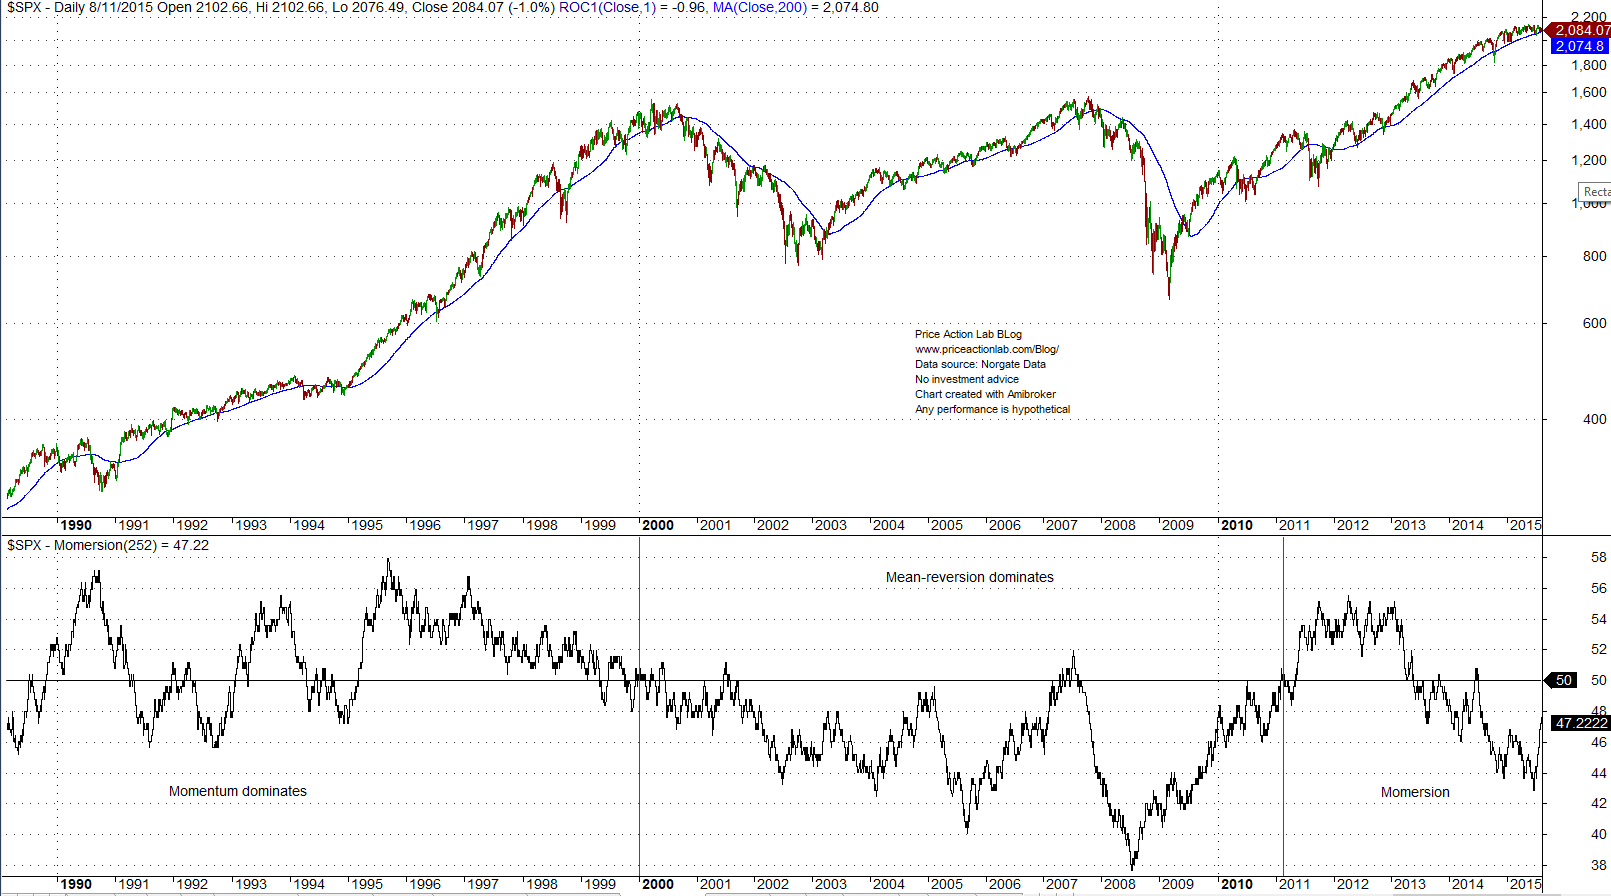
Below is a chart of Momersion(250) for S&P 500 index from 01/1989 to 08/11/2015.
Created with Amibroker – advanced charting and technical analysis software. https://www.amibroker.com
When the Momersion(n) indicator is below the 50% line, price action is dominated by mean-reversion and when it is above it, it is dominated by momentum. It is clear that other than a recent surge for a short period after 2011, with the help of a lot of quantitative easing, momentum died around the peak of the tech bubble market. A few remarks:
- There can be trends in mean reverting mode, as in the 2000s
- Trend-following works also with trends that occur in mean-reverting mode
- When mean-reversion dominates, the probability of extreme events is high
- After 2011 the market is in a state of “momersion”
The most challenging markets to trade are those that are in a state of momersion, i.e., they dynamically change from momentum to mean reversion constantly.
Article updated September 19, 2020, with Amibroker code for subscribers and a new chart.
Charting and backtesting program: Amibroker
If you found this article interesting, you may follow this blog via RSS or Email, or in Twitter


Red
Is is possible that there is another error? Did you mean to say 'above'?
"Below is a backtest of a basic system in SPY since inception, without any filters, that buys when the 20-day moving average of the 250-day Momersion is below 45 and sells when the same moving average rises below [ above ] 45."
Thanks for the great post,
Red
Michael Harris
Thanks Red, errors were corrected and credit was given.
"Below is a backtest of a basic system in SPY since inception, without any filters, that buys when the 20-day moving average of the 250-day Momersion is below 45 and sells when the same moving average rises above 55 (Corrected on 09/16/2015 thanks to a comment by Red below) ."
Jasan
The action should be the reverse of what is given under the 20-MA of the 250 Momersion ?
<<snip>>
"Below is a backtest of a basic system in SPY since inception, without any filters, that buys when the 20-day moving average of the 250-day Momersion is above 55 and shorts when the same moving average falls below 45.
<<snip>>
The graph has the green when crossing below 45 and red when crossing above 55.
Michael Harris
Hello Jasan,
Thanks for catching this error. I corrected the text as follows:
"…that buys when the 20-day moving average of the 250-day Momersion is below 45 and sells when the same moving average rises below 45."
I was aware of this error but was busy with the release of my new book and forgot all about it.
Michael
David
Thank you for sharing your quant work. We were able to improve our hedge fund algos after including this indicator.
Samuel
Hi Michael,
Thanks for sharing this indicator. I am planning to use it to determine periods during the trading session where the underlying is “most likely” not going to strongly trend so that I can scalp it/martingale within a defined risk limit.
A few years ago, I wrote an FX algo that traded similarly but only at specific hours of the day where I knew the pair had a tendency to stay in a range. It produced 11% in a month, but I had to shut it down because of other reasons not related to trading.
Samuel
John
Michael, this is an interesting article of great value. Thank you for explaining the concept and for sharing you quant work.
John
Michael Harris
Thanks John.
Gary
Can you tell me what function inc() does?
Michael Harris
Hello Gary,
It inc(rements) the variable by 1.
Michael
Sam
Very interesting article. Thanks. I just do not understand why: "After 2011 the market is in a state of “momersion”"? Based on what? Based on the "chart of Momersion(250) for S&P 500 daily data since inception to 08/12/2015" could be anything: mean reversion, momentum, … Can you please explain reasons why this picture indicates a new "regime" called "momersion"? Thanks.
Michael Harris
Hello Sam
This is what the indicator shows with a period of 250 returns. Momersion is a period where momentum is followed by mean-reversion with wild swings or the other way around. You can also see that from serial correlation charts.
Since 2001, the Momersion(25) indicator has fluctuated from 56 to 44, something that has not happen before, indicating a change in market dynamics in that period.
Note that all indicators are defined and are artificial constructs. There are no natural indicators of price offered to us as laws of nature. In this regard, I defined an indicator that agrees with historical price action. You can go ahead and define a different indicator if you wish. This is how technical analysis works.
Michael
Michael Harris
Hello Sam,
I received your email but I would prefer that if you have any questions and/or comments to make about these posts to better make them here because that helps me to organize my replies.
I will not be able to check your R code but I do not think the results fully agree with my calculation of momersion. Regardless, the way I interpret it is directly from the chart, as follows:
1. From 1995 to 2000 the momersion indicator was above the 50% line, indicating a state of momentum. Also, from the late 1980s to 2000, the indicator stayed above the 50% line for the most part.
2. From 2000 to 2011, the indicator stayed below the 50% line, indicating mean-reversion.
3. From 2011 to present, the indicator has fluctuated around the 50% line, indicating a state of momersion in this period.
Note that interpretation of all indicators depend on the calculation windows considered.
Michael
Sam
Thanks for your answer.
I am trying to replicate your momersion indicator based on the pseudo code you posted. Unfortunately I guess I do not know exactly what it means since, as you have noticed, I can not replicate your results 100%. I come very close (identical I guess after year 2000) if I use dividend and split adjusted data for SPY. But results before 2000, especially at the beginning of 1994 are off quite a bit.
Can you please explain what does r(i) means? And why you are using i = 2 to n+1 ? I understood that for every date (say Friday, 14th of August, 2015) you look at product of pairs of returns (types of returns, as I understand, don't matter actually since only sign is important) from day before and two days before (and do this for n + 1 return pairs in history). This would mean that you would calculate value of momersion indicator for Friday, 14th of August, 2015 as:
– (i = 2): calculate return(Tuesday to Wednesday)*return(Wednesday to Thursday) and depending on sign of return product increment either mean reversion count or momentum count
– (i = 3): calculate return(Monday to Tuesday)*return(Tuesday to Wednesday) and depending on sign of return product increment either mean reversion count (MRc) or momentum count (Mc)
…
– (i = n + 1) …
Is my understanding correct?
Thanks in advance for your answer.
Kind regards,
Sam
Michael Harris
Hello Sam,
I guess the n = 2 to n+1 can be confusing but it was done because we did not want to have a 0 index in a vector as a matter of convention only since we are multiplying two consecutive returns and, as you correctly point out, we only care about signs and not magnitudes (as for example in correlation).
Thus, at every point j in the series, for a rolling period n, you calculate:
r(i) and r(i-1) , i = 2, …, n+1
I could have defined this as i=1,…,n and start with r(0) to r(n).
This is not what is important. It is convention.
I start from 2 because in the pseudo code I consider r(1) to be the first index in a vector and I need n products of returns. In the period n, you have n returns r(n) anyway but I go from 2 to n+1 because the first index is r(1). Just a convention. You can do it as you like.
What is important is to calculate the product of two consecutive returns in a given period, in this case 250.
r(i) is the daily return, r(i)/r(i-1) -1.
Michael
Sam
Michael, thanks. This explains a lot.
I just need to understand one more thing so am kindly asking for one final explanation. When you are at the point j in the series (say j represents a particular day in daily bars) is momersion(j) based on pairs of returns taken from a set r(j), …, r(j – n + 1) (you start your 250 window at j) or on r(j – 1) to r(j – n)? Put it another way: are you calculating momersion indicator for Friday, 14th of August 2015 using returns from Thursday to Friday and Wednesday to Thursday (return product pair 1), … or from Wednesday to Thursday and Tuesday to Wednesday, … ?
I guess the difference I still get are related to the data quality issues.
Thanks in advance for your answer.
Kind regards,
Sam
Michael Harris
Hello Sam,
This is the correct one:
…Friday, 14th of August 2015 using returns from Thursday to Friday and Wednesday to Thursday (return product pair 1),
The rest are vector conventions.
Michael