The PSI5 algo is not a data-mined but based on a formula that models price action from a text in probability theory. The algo can be used in mean-reversion (convergent) or trend-following (divergent) mode. The examples below are for the performance of the algo in a divergent mode in the case of futures, with daily and intraday data.
Case 1. Daily data and 23 futures contracts
Strategy
Initial capital: $10 million
Timeframe: Daily data
Markets: 23 futures contracts (Norgate Data)
Strategy: PSI5 algo, long-short
Entries: Next open
Exits: Next open or stop intraday.
Risk management: Stop-loss based on ATR
Position sizing: Based on 0.5% risk per position
Backtest period: 01/03/2000 – 06/15/2023
Commission and slippage: None
Equity curve, Yearly returns, Daily Returns, and Drawdown profile
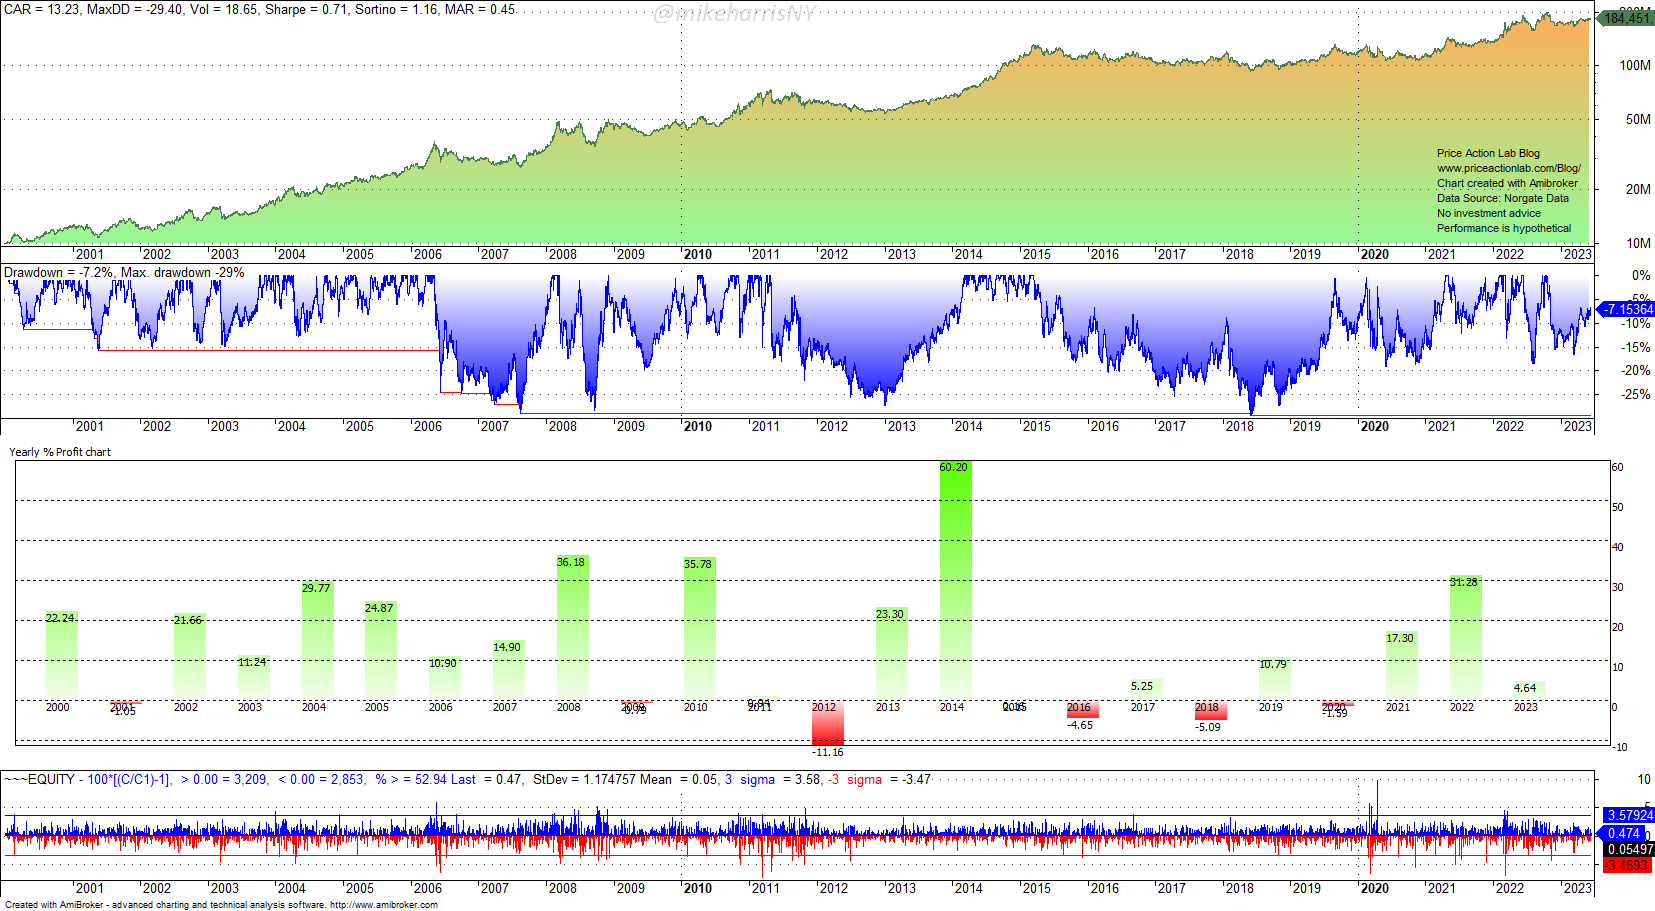
The drawdown profile can be adjusted by varying the risk percent per position but that will also affect most performance parameters.
Performance parameters
| Long Trades | Short Trades | ||
| CAGR | 13.2% | ||
| Max. DD | -329.4% | ||
| Volatility | 18.7% | ||
| Sharpe | 0.71 | ||
| Win% * | 19.8% | 10.8% | 9.0% |
| Trades | 1042 | 542 | 500 |
| Avg. Bars Held | 97.1 | 106 | 88 |
| Avg. Trade | 18.1% | 27.9% | 7.4% |
| Exposure | 65.6% | 44.0% | 22.6% |
* The effective win rate based on a 21-day adjustment period is 57.8%
Lookback period sensitivity analysis
In the above results, we have used a lookback period of 150 days. Below are the results after varying the lookback period from 5 to 200, in increments of 5.
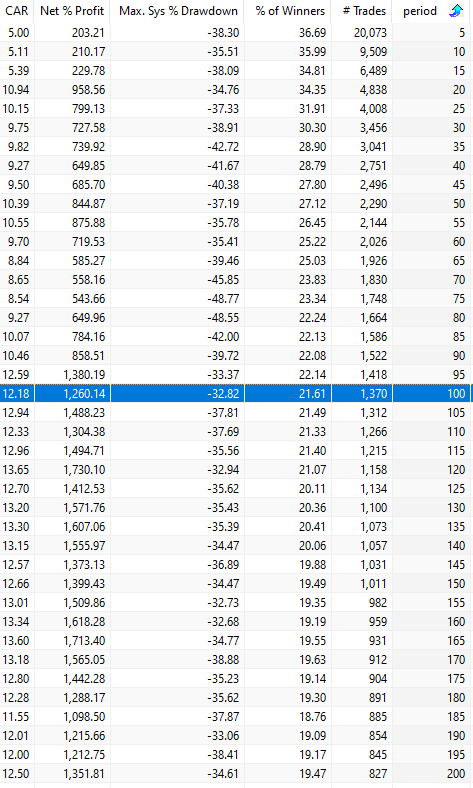
The strategy is profitable for all lookback periods from 5 to 200 increments of 5. Our choice of 100 days lookback period was arbitrary. A good choice of lookback period appears to be in the range of 100 to 120 days.
Risk percent sensitivity analysis
In the above results, we have used 0.5% for position percent risk. Below are the results after varying the percent risk from 0.25 to 0.5, in increments of 0.25.

The best range seems to be 0.75% to 0.5%. Due to the low win rate, values of risk percent above 1.5% or below 0.25% cause performance deterioration.
Case 2. Intraday 4-Hour data and five futures contracts
Strategy
Initial capital: $1 million
Timeframe: 4-hour data
Markets: 5 futures contracts: Bund, Gold, Platinum, Palladium, Dax
Strategy: PSI5 algo, long-short
Entries: Next open
Exits: Next open or stop intraday.
Risk management: Stop-loss based on ATR
Position sizing: Based on 0.5% risk per position
Backtest period: 09/05/2012 – 09/05/2022
Commission and slippage: None
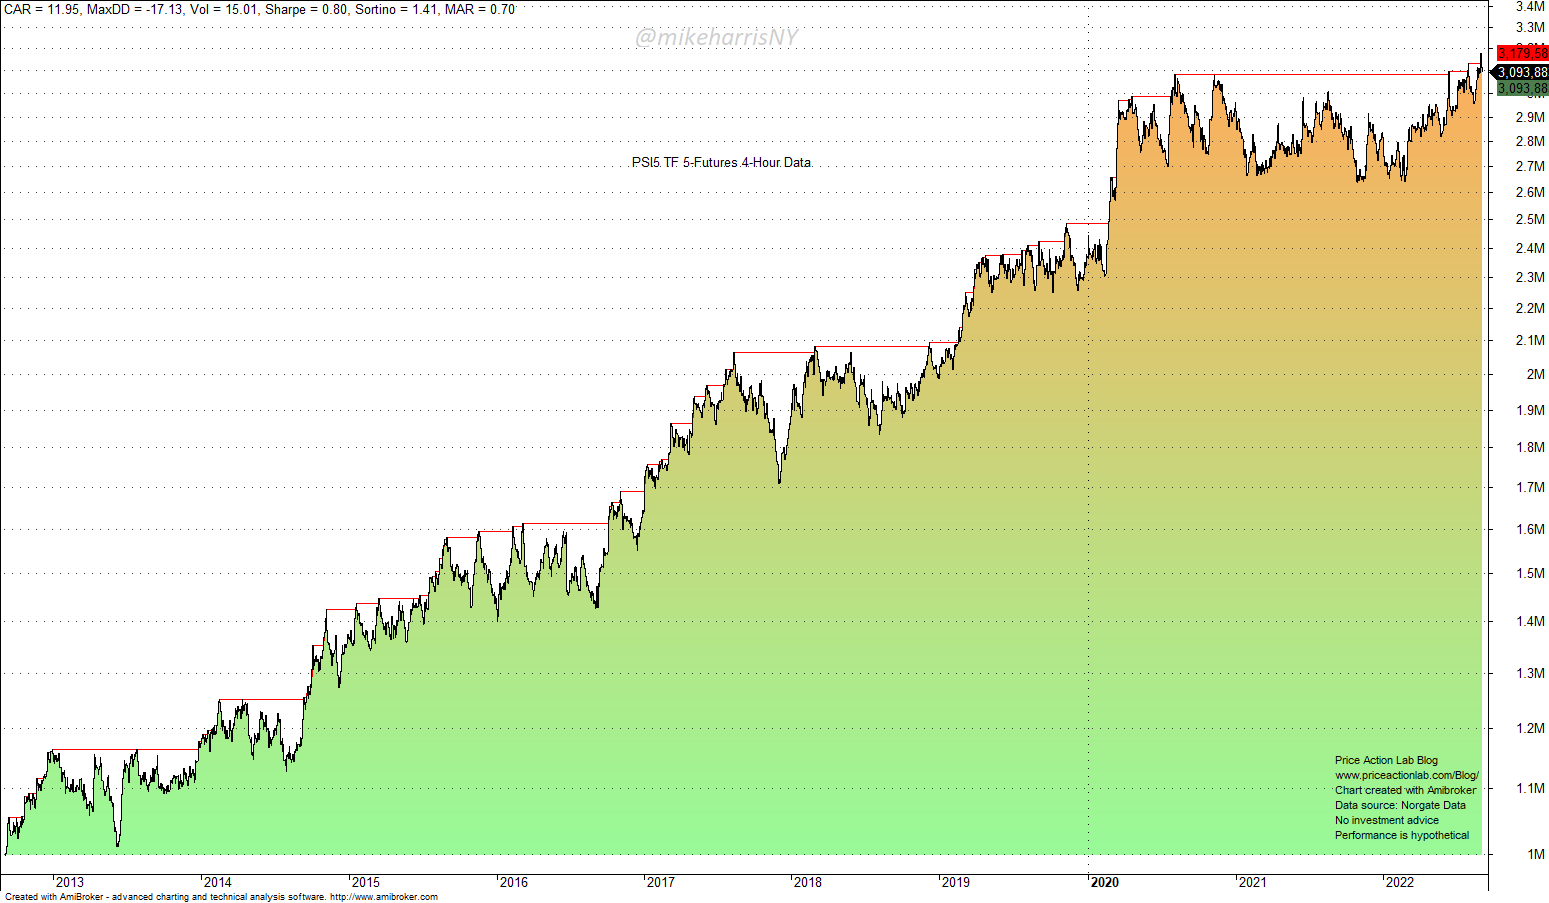
Equity curve
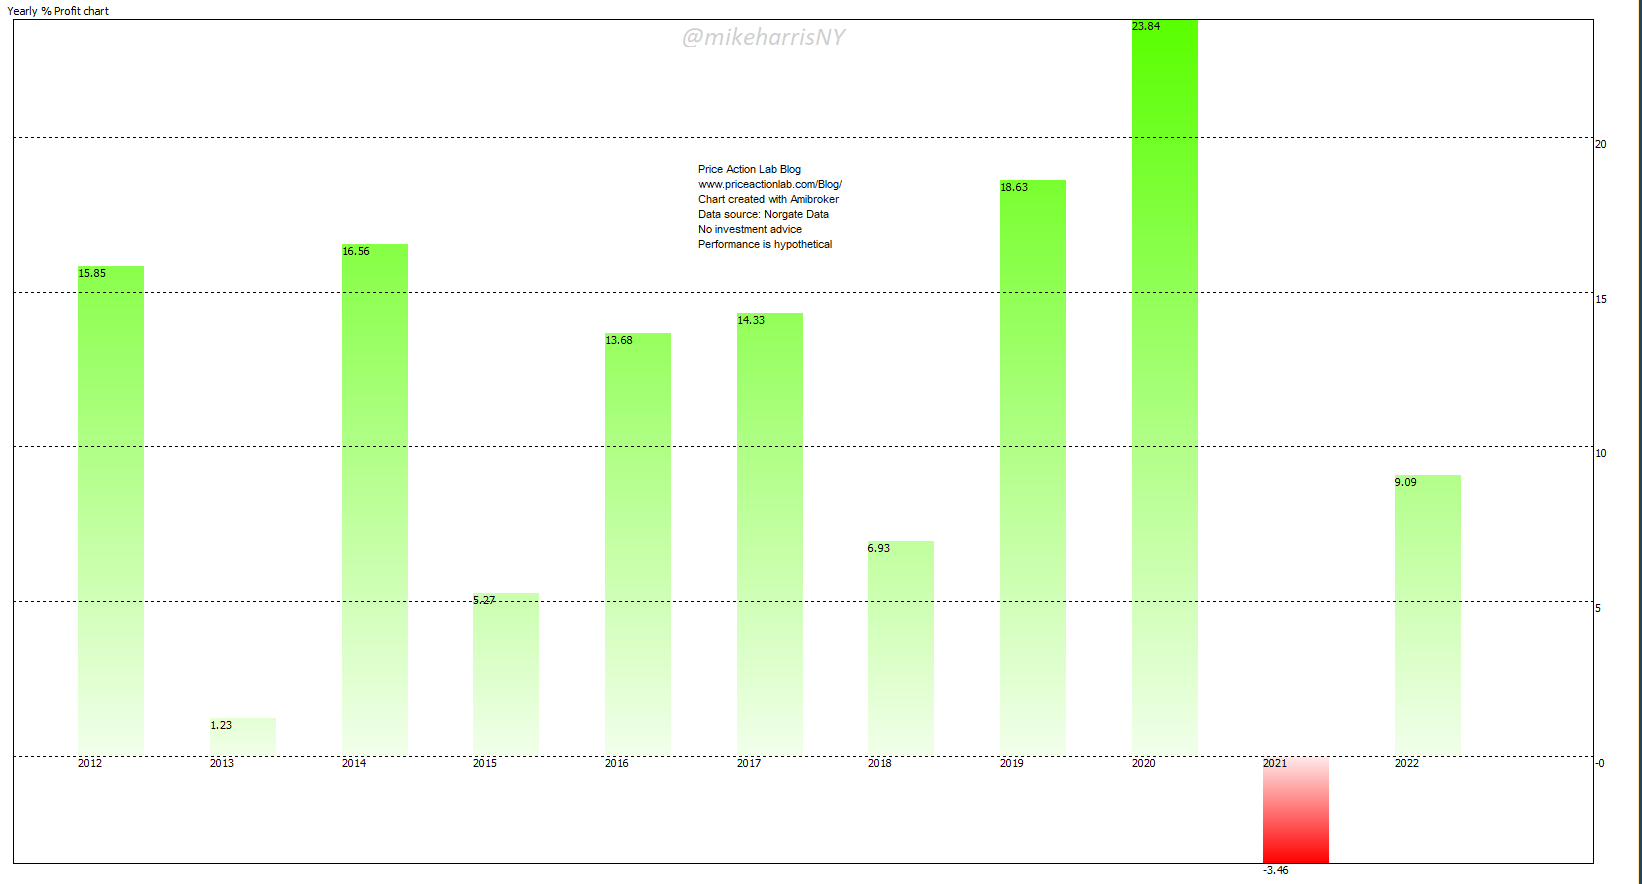
Yearly returns
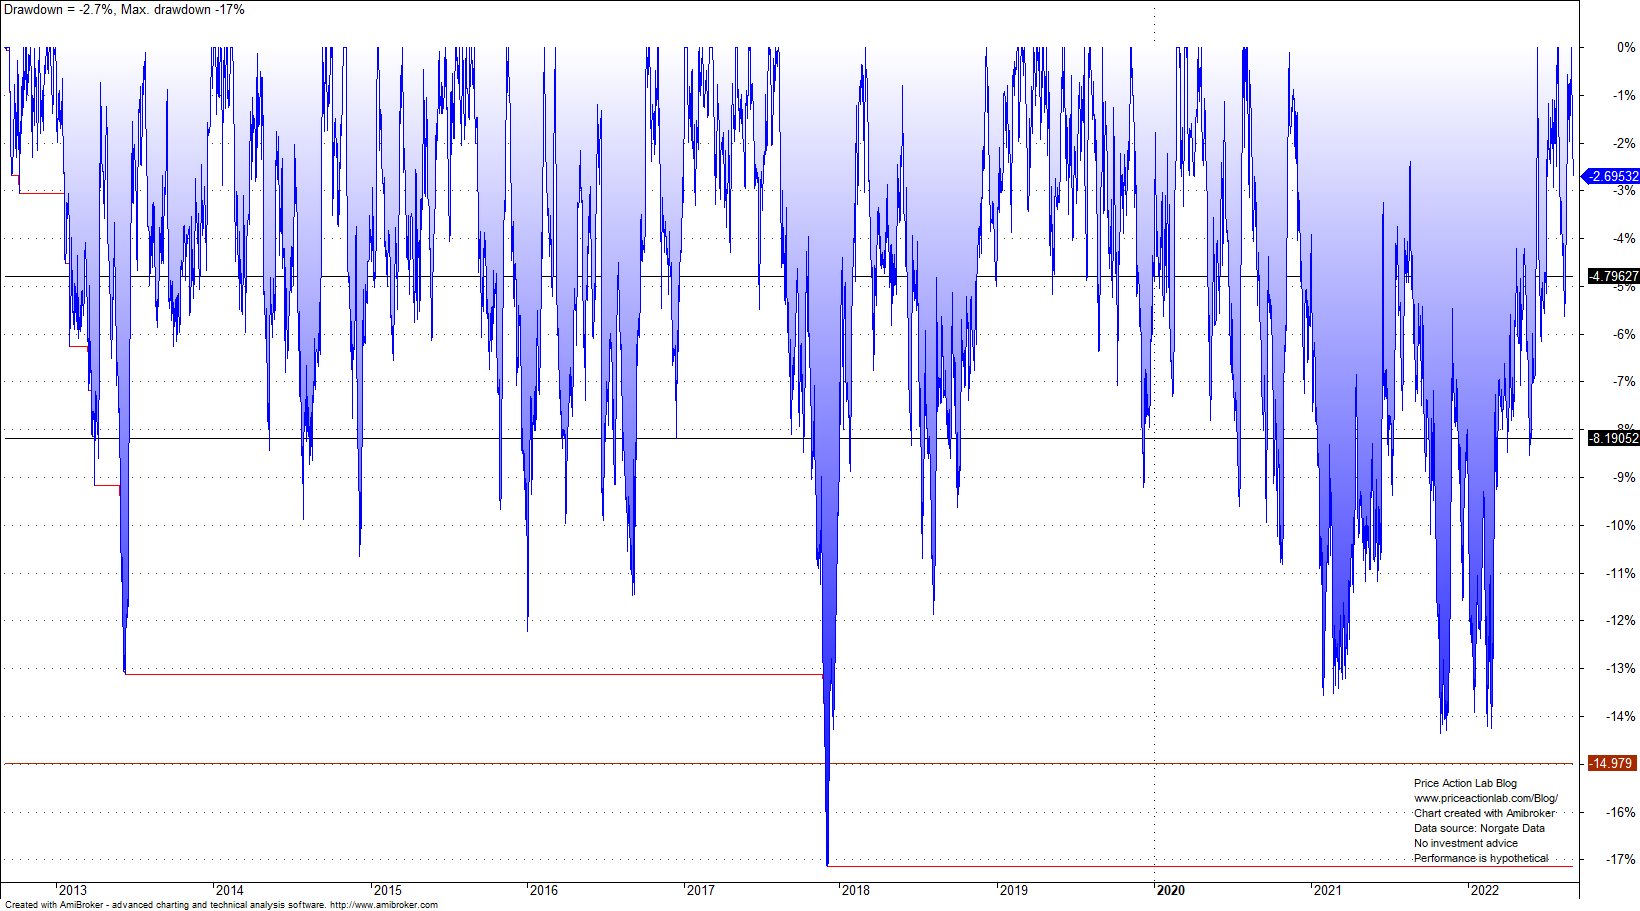
Drawdown profile
Performance parameters
| Long Trades | Short Trades | ||
| CAGR | 12% | ||
| Max. DD | -17.3% | ||
| Volatility | 15.0% | ||
| Sharpe | 0.80 | ||
| Win% | 33.3% | 18.3% | 15% |
| Trades | 3719 | 1879 | 1840 |
| Avg. Bars Held | 21.1 | 21.9 | 20.2 |
| Avg. Trade | 1.07% | 0.92% | 1.22% |
| Exposure | 22.7% | 12.2% | 10.5% |
Look-back period sensitivity analysis

The strategy is profitable for all lookback periods from 5 to 100 increments of 5. Our choice of 15 bars lookback period was somewhat arbitrary. A good choice of lookback period appears to be in the range of 5 to 20 bars.
Risk percent sensitivity analysis
In the above results, we have used 0.5% for position percent risk. Below are the results after varying the percent risk from 0.25 to 0.5, in increments of 0.25.
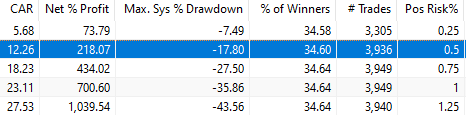
The best range seems to be 0.75% to 0.5%. Due to the low win rate, values of risk percent above 1.25% or below 0.25% cause drawdown performance deterioration, although for higher risk percent the annualized return is also higher.
The PSI5 algo rules are available for sale. Click here for more details.