Details of performance calculations:
- Equal allocation to all strategies.
- The start of the backtest is on January 3, 2007, except for long-short.
- The start of the backtest for long-short is on July 1, 2016.
- End of backtest is on June 3, 2022.
- Commission: $0.01/share for all strategies except for long-short ($0.005/share).
- All trades are placed at the open of the next weekly bar.
- There is no use of leverage.
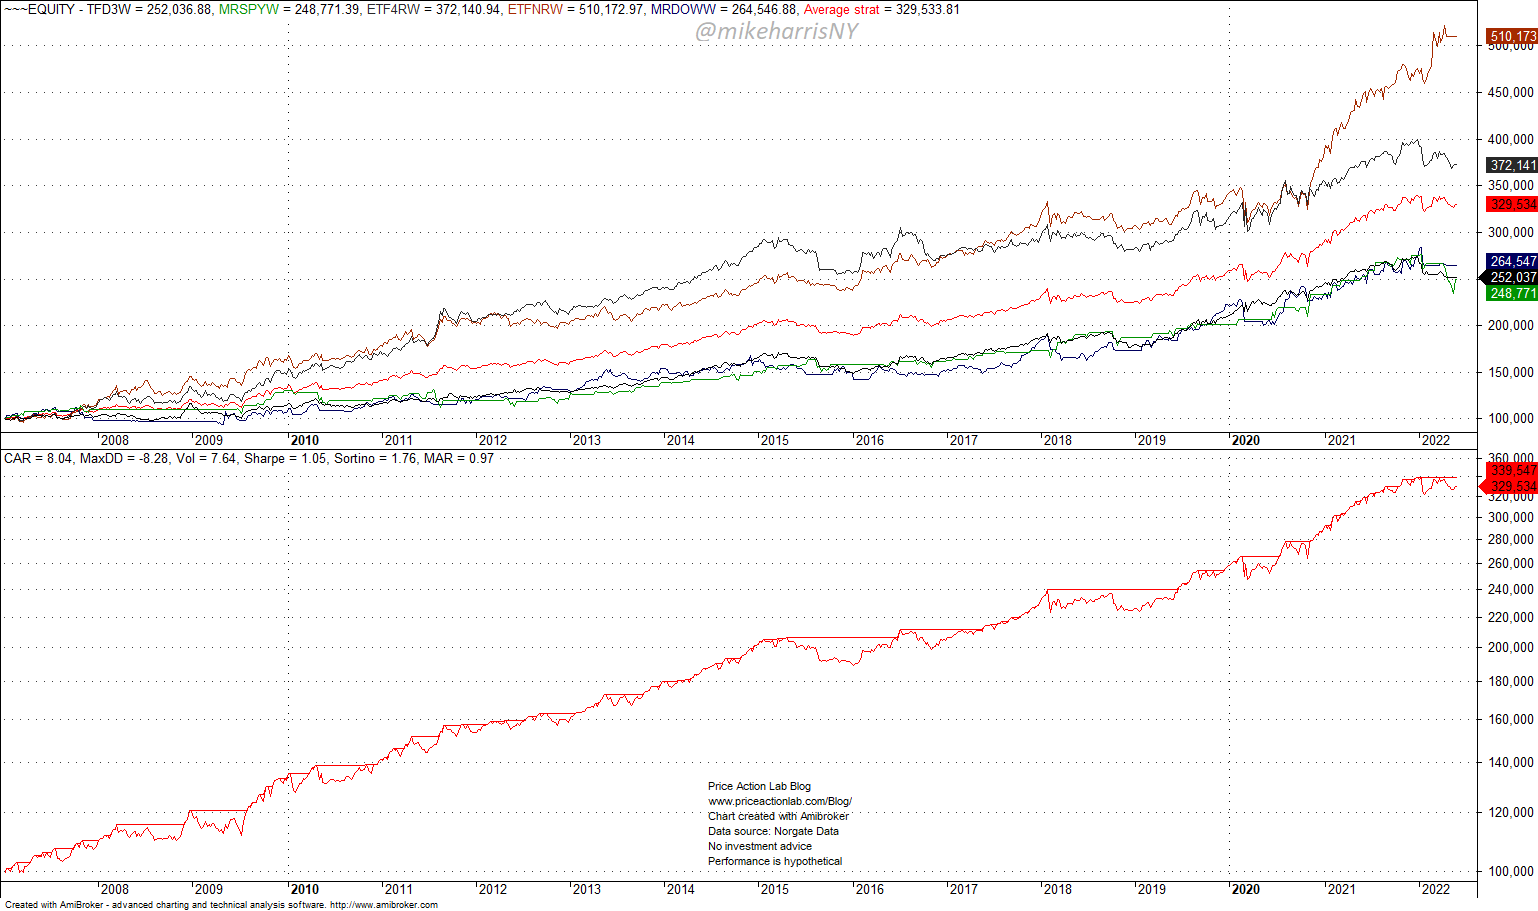
Five strategies (excluding long-short)
Equity Performance
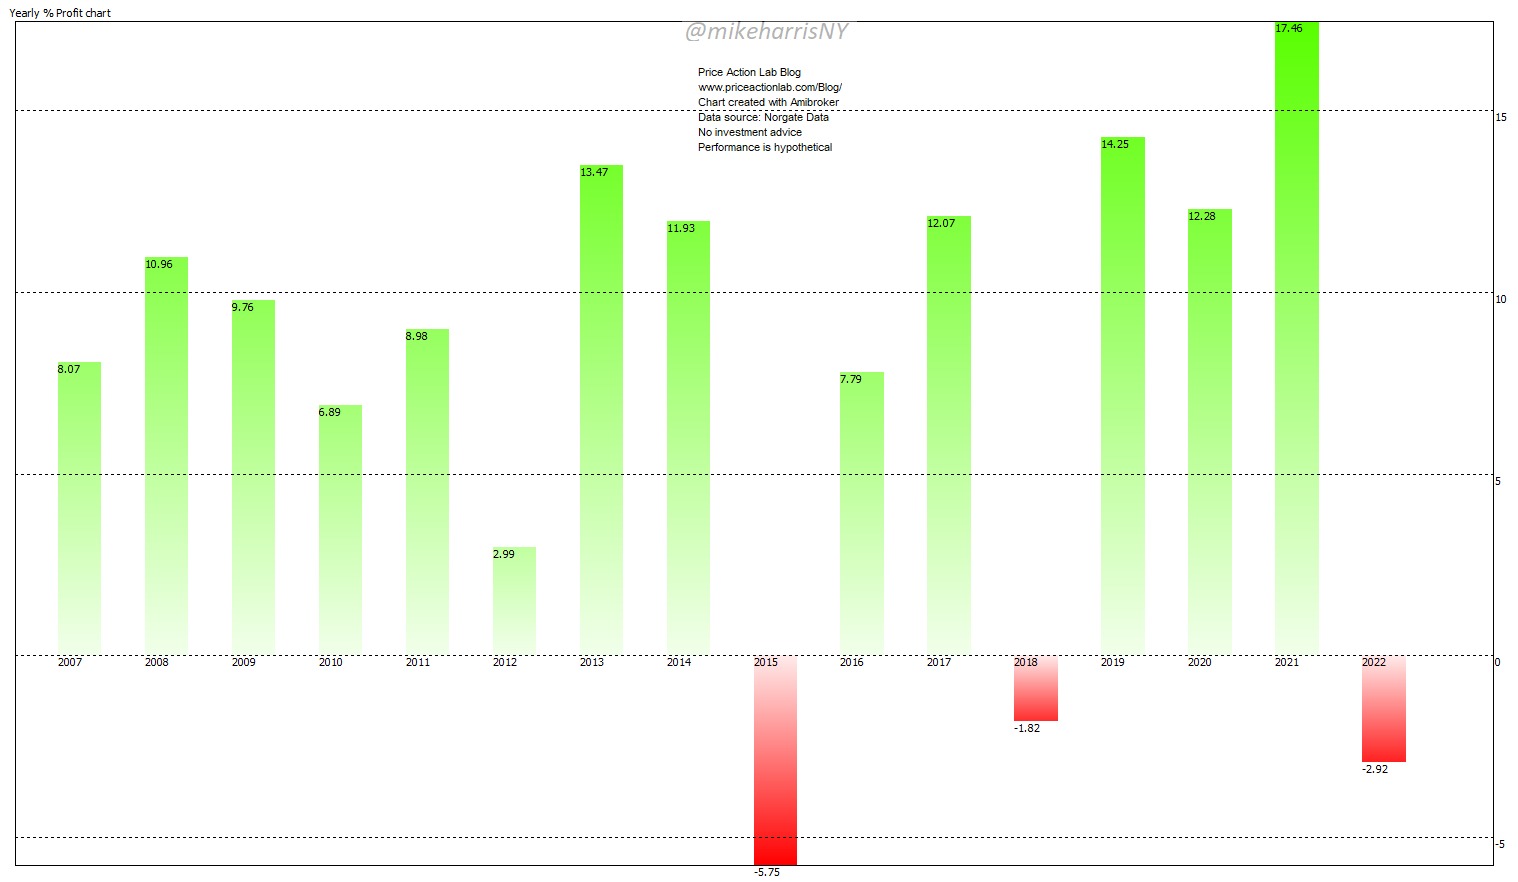
Yearly Return (%)
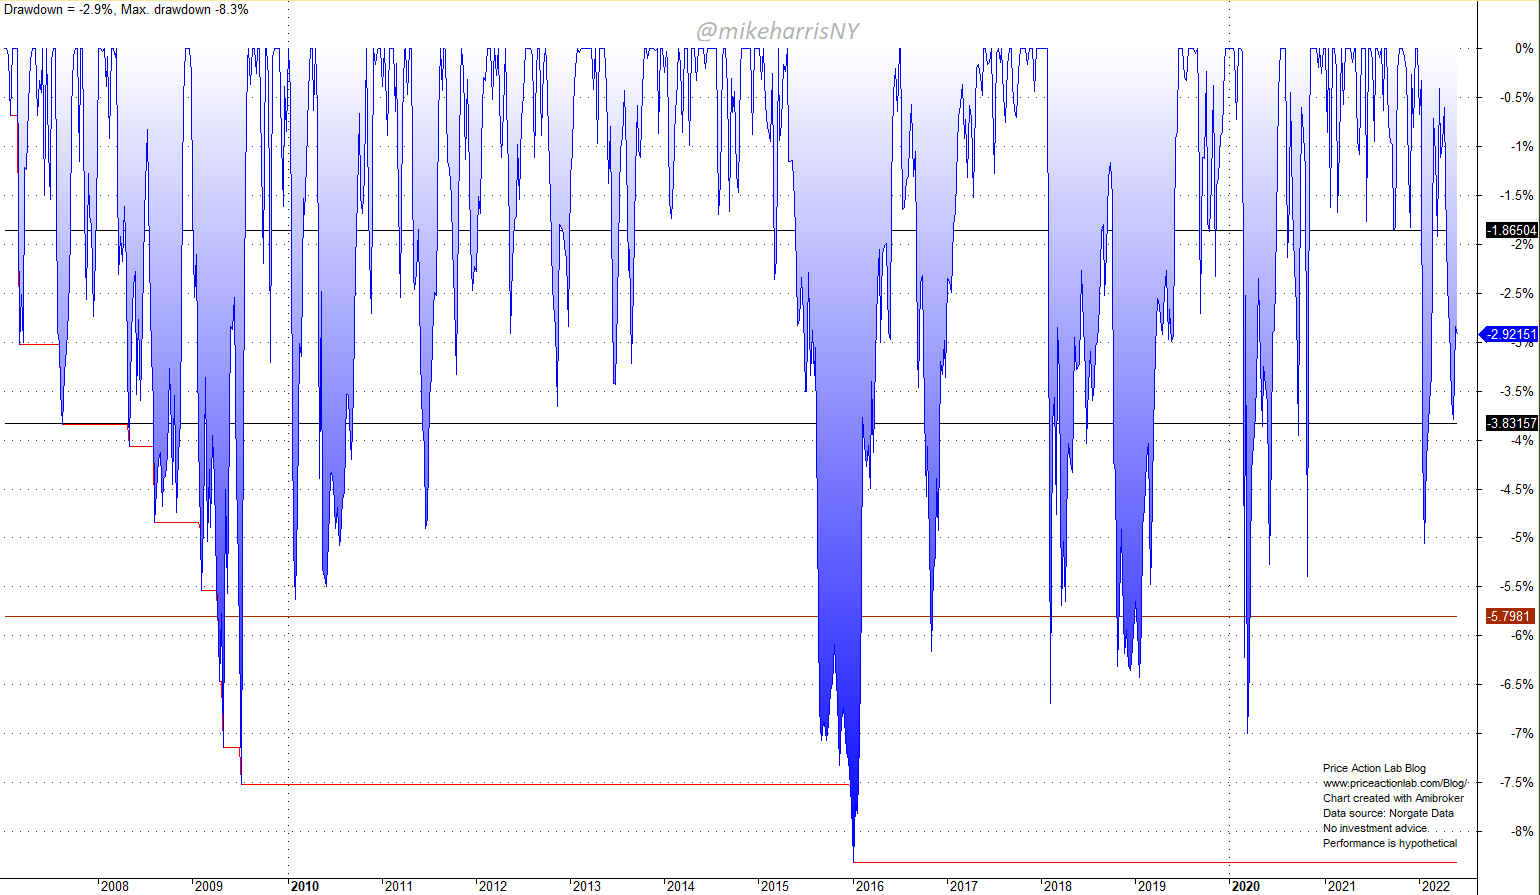
Drawdown Profile
Comparison of average performance of the five strategies excluding long-short to SPY ETF performance.
| Strategy | Buy and hold | |
| Annualized return | 8% | 9.3% |
| Maximum Drawdown | -8.3% | -55.2% |
| Volatility | 7.7% | 20.3% |
| Sharpe ratio | 1.05 | 0.46 |
| MAR ratio (CAGR/MDD) | 0.97 | 0.17 |
The main benefit of using an ensemble of strategies is the low volatility of the equity curve. Leveraged alpha is possible while maintaining a low maximum drawdown. Note that the Sharpe ratio stays nearly constant under leverage.
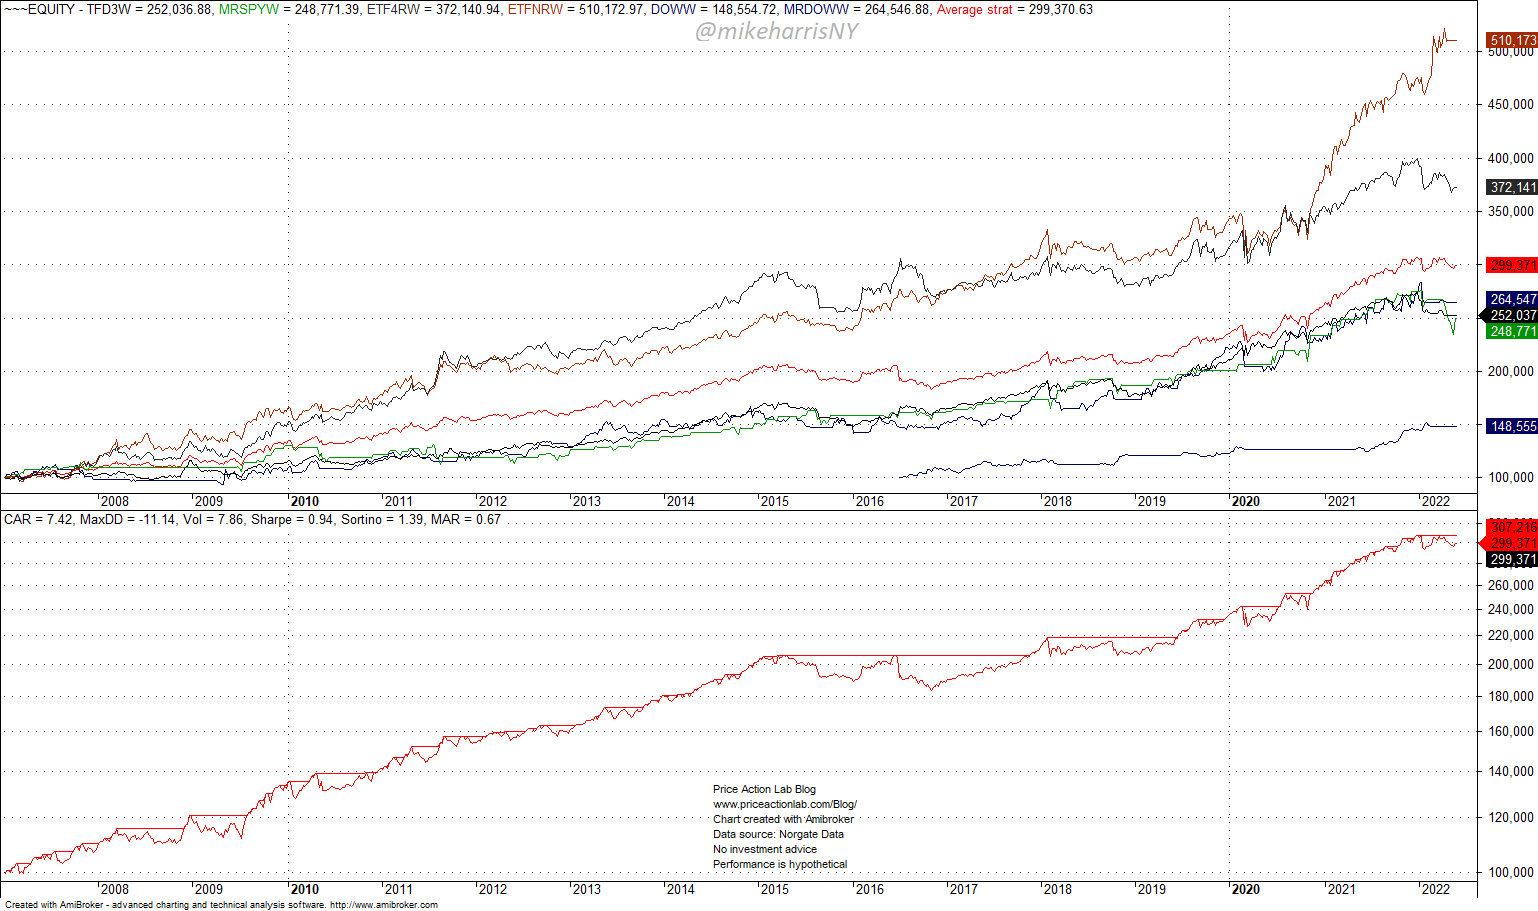
Six strategies (including long-short after July 1, 2016)
Equity Performance
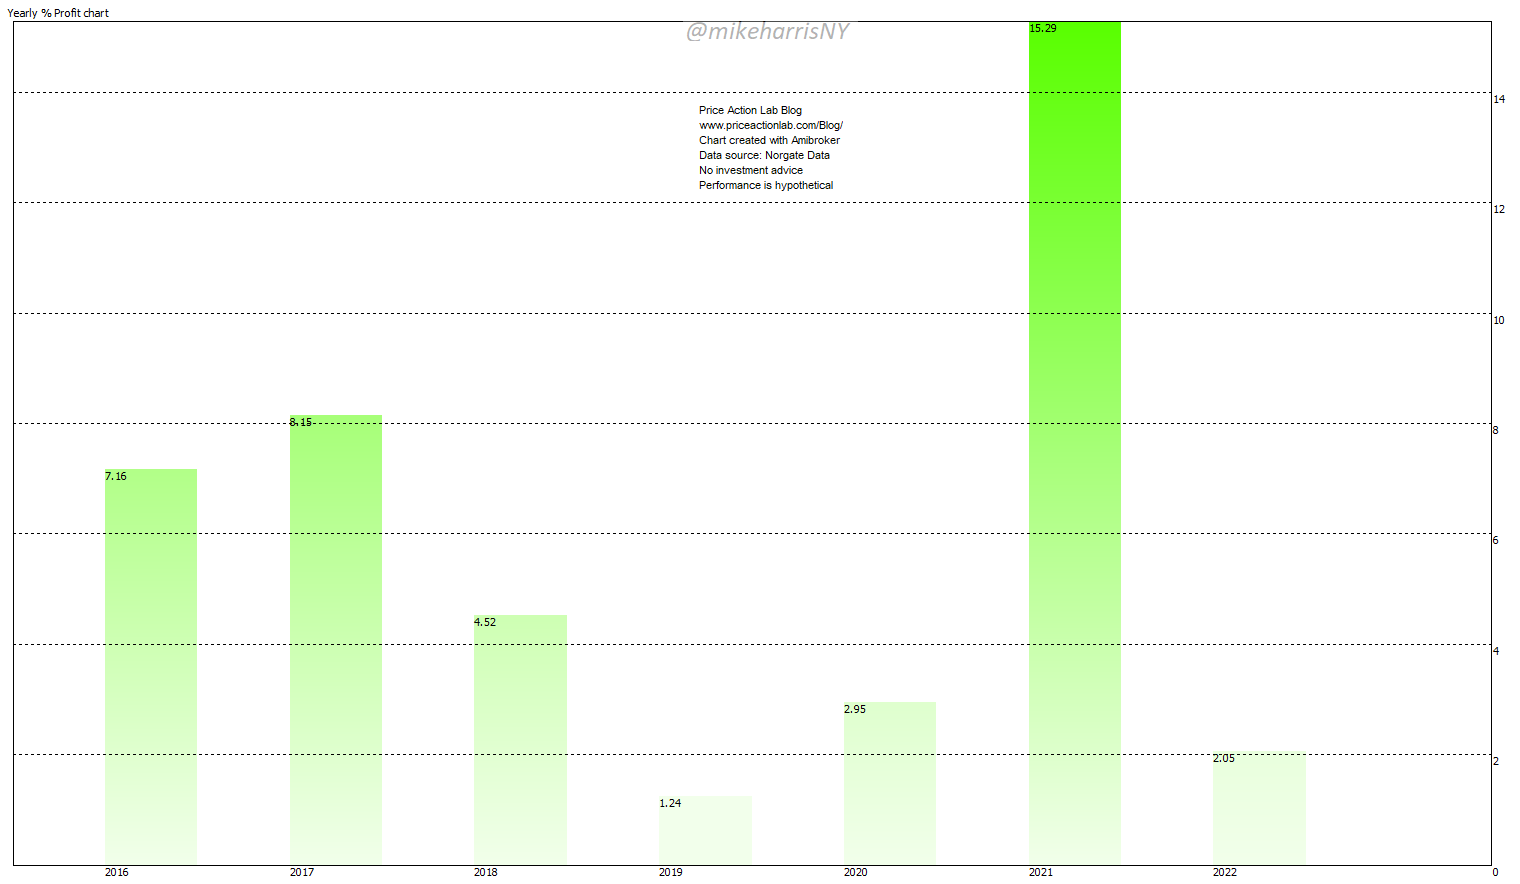
Yearly Return (%) of Long-Short Strategy
Click here to subscribe to the weekly signals.
Disclaimer: The Premium and Weekly Signals are provided for informational purposes only and do not constitute investment advice. We do not warrant the accuracy, completeness, fitness, or timeliness for any particular purposes of the Premium and Weekly Signals. Under no circumstances the Premium or Weekly Signals should be treated as financial advice. The author of this website is not a registered financial adviser. Before subscribing please read our Disclaimer and Terms and Conditions.
Copyright notice: Any unauthorized copy, reproduction, distribution, publication, display, modification, or transmission of any part of this report is strictly prohibited without prior written permission.
