

After you read this you may wonder who actually reads these articles. I suspect not too many because there is no hype here, just hard work. But making the distinction between market journalism and quant analysis is useful in my opinion.
All the gains in SPY this month have come from overnight gaps. This is a fact. Is this a useful fact? What is the relation between facts and strategies? What distinguishes market journalism from trading and quantitative analysis?
Facts about markets fascinate the public but traders and quants know that for the most part they are irrelevant, if not detrimental, to profitability.
The relation between facts and strategies is clear to traders and quants: a strategy uses facts about events that consistently repeat in the future and result in positive expectation with high statistical significance for particular actions in the market.
As you see, there is a tremendous gap between facts and strategies. Facts are fun, for example, “The S&P 500 has not have a 3% drawdown in 293 days”, which is actually the case now. But what can you do with this fact? Should you stay long or sell/short?
Fact: all gains in SPY ETF this month have come from overnight gaps.
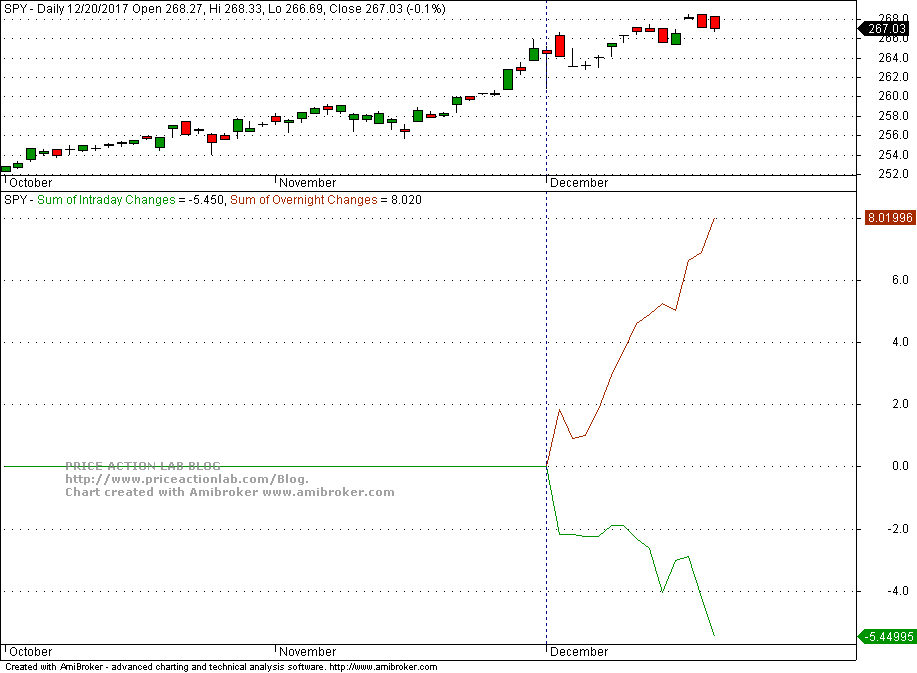
It may be seen from the above chart that since the start of the month, the contribution of overnight changes is +$8.02 per share versus -$5.40 for regular trading hours. Therefore, the net gain of SPY in December so far is 100% due to overnight charges.
But was this true last month? Actually, it was not and in fact the opposite happened.

Regular trading session contributed about $8 to SPY price but overnight lost about $1.
So what good is the fact about overnight gaps in December? Next month the pattern may change.
This is not a very useful in the context of trading and obviously useless for investors but interesting for market journalism.
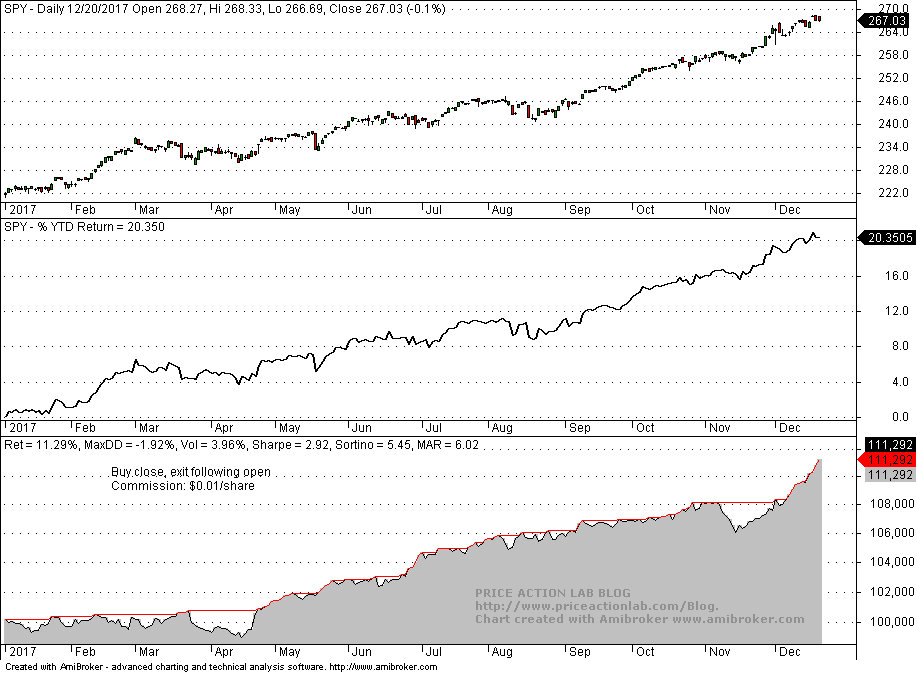
In fact, year-to-date the contribution of overnight is a little more than doubled that of regular hours, which means that the strategy of buying at the close and exiting at the next open would have generated slightly more that half the year-to-date return.
However, chasing overnight gains generates a lot of trading friction due to commission and slippage. I have added commission of $0.01 per share in the backtest below and the return of the strategy is 11.3% year-to-date versus about 20.5% for SPY based on the open price of the year on January 3, 2017.
What is the performance of this strategy since inception?
Without commission and slippage the performance looks excellent:

CAGR of the strategy is 10.20% versus 9.54% for buy and hold but risk adjusted MAR is almost double for the strategy.
But after adding $10 commission and slippage per trade, performance becomes indistinguishable from buy and hold in statistical terms:
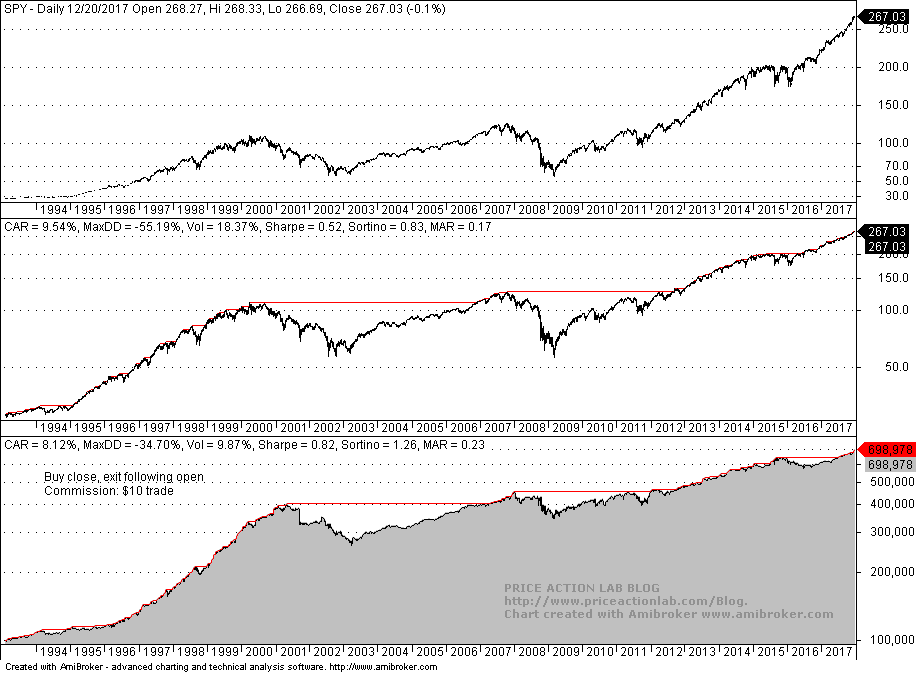
As you see the bulk of the gains came from that 1990s period that is still the cause of bias for many investors, visual traders, chartists but also quants. In fact, since 2000 the strategy equity is random after commission with 0.5% CAGR and MAR at 0.01:

These are the facts, from the perspective of a trader and quant, vs. just the facts from market journalism. As you see, it takes a lot of work to cover the distance from naive facts to useful strategies based on facts. This makes naive facts fun because few are always willing to do the hard work.
If you found this article interesting, I invite you follow this blog via any of these methods: RSS or Email, or follow us on Twitter
If you have any questions or comments, happy to connect on Twitter: @mikeharrisNY
Charting and backtesting program: Amibroker
Quantitative analysis of Dow-30 stocks and 30 popular ETFs is included in our Weekly Premium Report. Market signals for longer-term traders are offered by our premium Market Signals service. Mean-reversion signals for short-term SPY traders are provided in our Mean Reversion report.


