


If in business school you were taught that high positive correlation means that when one security moves, either up or down, the other security moves in lockstep in the same direction and that high anti-correlation means that when one security moves, either up or down, the other security moves in lockstep in the opposite direction, then you ought to look at the correlation between stocks and bonds. Then you will understand how the markets defy mass knowledge and psychology modulation through it. Forget what you have learned no matter how much you paid for that knowledge.
I said “if” because there are always exemptions. But for anyone who has based investment or trading decisions on correlation levels between stocks and bonds these traditional definitions have not worked. I am not surprised because the market is not fond of knowledge one can easily find in books or articles and nobody has ever profited from such knowledge.
Below is a chart of the 120-day rolling correlation between SPY and TLT (bottom pane). The top pane shows a chart of SPY and the middle pane a chart of TLT. The green arrows show periods of relatively flat markets, the red arrows periods of declining markets and the blue arrows periods of rising markets:
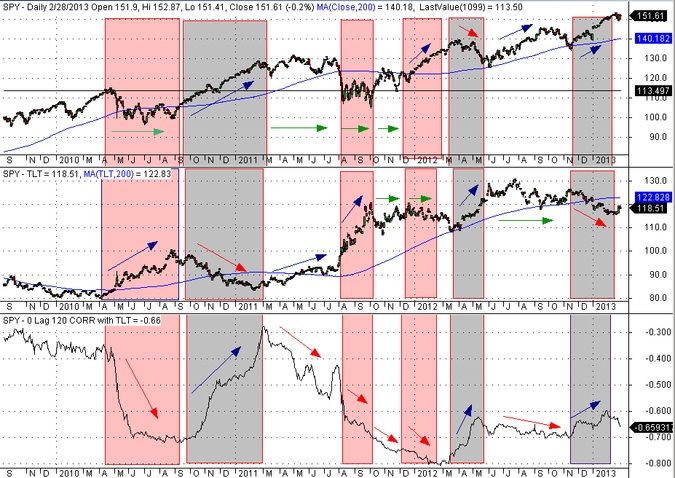
It may be seen that for the correlation to decline substantially at least one green arrow must be present in one of the markets, i.e. one or both of markets must be relatively flat. In the absence of a green arrow, the correlation is rising no matter which market is on a rise or decline.
What does this empirical fact mean?
It means that the market will not give away easy profits to those who think that a low or declining correlation between stocks and bonds in a rising stock market implies necessarily a decline in bond prices. In other words, the market is fooling those who believe in that fable they possibly heard in school or read in some book. The proof is on the charts above. While bond prices were declining recently and stock prices were rallying, the correlation between bonds and stocks was rising instead of falling the same way it did in the period October 2010 – March 2011.
Disclosure: no relevant position at the time of this post and no plans to initiate any positions within the next 72 hours..
Charting program: Amibroker (Charts created with AmiBroker – advanced charting and technical analysis software. http://www.amibroker.com/”)


